
|
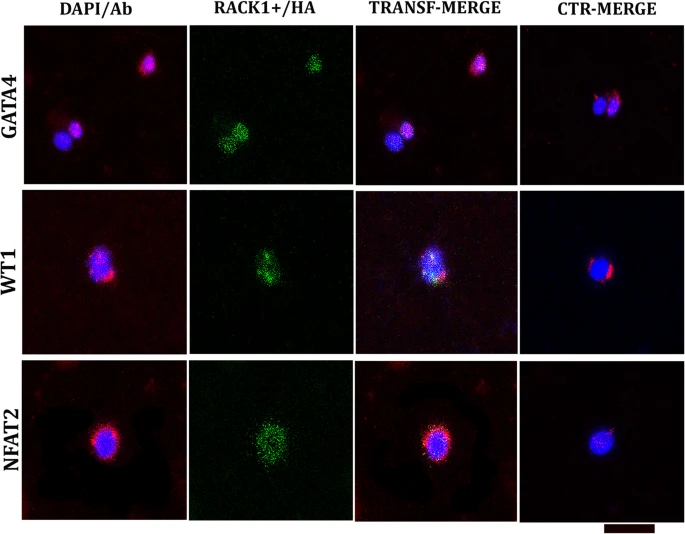
Fig. 7 Confocal microscopy analysis after transfection and one week of culture in medium supplemented with GFs (T1). The plasmid containing RACK1/HA emitted green fluorescence. The cells were double-labelled with embryonal markers (GATA4, WT1, and NFAT2; red fluorescence) and compared to nontransfected cells (CTR). GATA4 is strongly increased in transfected cells and is localized mainly in the nucleus. Compared with CTR, WT1 is highly expressed in the nucleus and cytoplasm. Compared with its expression in the nucleus, NFAT2 is more highly expressed in the cytoplasm than CTR, which is localized in the nucleus. Nuclei are marked with DAPI (blue fluorescence); DAPI/Ab: DAPI labelling + antibody (GATA4 or WT1 or NFAT2). TRANSF/MERGE: transfected cells labelled with all the antibodies (against HA and one embryonal marker). CTR/MERGE: nontransfected cells labelled with all the antibodies. The hearts utilized for the experiments were N = 3, and analysis was performed with 104 cells in each group in triplicate. Bar: 20 μm.