
Image
|
Figure Caption
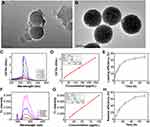
Fig. 1 The loading efficiency and release efficiency in NPMOF of XAL. (A) TEM image of NPMOF with an average size of 100 nm. (B) TEM image of XAL-NPMOF. (C) UV‒Vis absorbance and (D) standard curve of XAL in DMF. (E) The loading performance of XAL at 2, 4, 8, 12, 24, 48, and 72 h. (F) Fluorescence and (G) standard curve of XAL in 0.5% hyaluronic acid. (H) The release performance of XAL at 4, 8, 12, 24, 48, and 72 h. Scale bars in (A) and (B), 100 nm.
Acknowledgments
This image is the copyrighted work of the attributed author or publisher, and
ZFIN has permission only to display this image to its users.
Additional permissions should be obtained from the applicable author or publisher of the image.
Full text @ Int. J. Nanomedicine