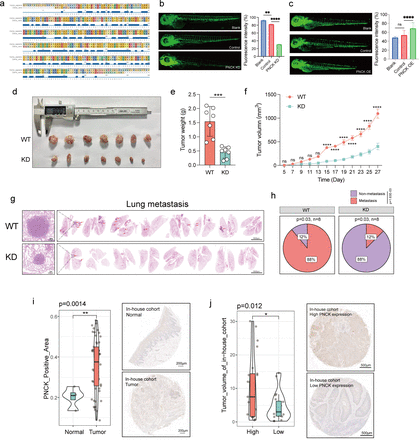
Fig. 3 Knockdown of PNCK significantly inhibits in vivo growth of HNSCC. (a) Homology comparison of PNCK gene between zebrafish and humans. The squares and letters in various colors at the top represent different amino acid sequences, while the blue squares at the bottom indicate overlapping portions of these sequences. (b, c) Comparison of zebrafish blood vessel fluorescence intensity after PNCK knockdown (b) and overexpression (c).A two-tailed unpaired Student’s t-test was performed. Data are presented as mean values±SD. (d) Subcutaneous tumor growth in C3H mice (n=7 biologically independent samples). (e) Comparison of mouse tumor weights. A two-tailed unpaired Student’s t-test was performed. Data are presented as mean values±SD. (f) Mouse tumor growth curve. A two-tailed unpaired Student’s t-test was performed. Data are presented as mean values±SD. (g) HE staining of lung metastatic nodules in mice (n=8 biologically independent samples). (h) The pie chart shows the percentage of mice that developed pulmonary metastases. Two-tailed χ2 test. (i) Difference in PNCK-positive area and HE staining between normal and tumor tissues in HNSCC tissue microarray (n=60 biologically independent samples). A two-tailed unpaired Student’s t-test was performed. Data are presented as mean values±SD. (j) Difference in tumor volume between PNCK high and low expression groups in HNSCC tissue microarray, and corresponding HE staining (n=60 biologically independent samples). A two-tailed unpaired Student’s t-test was performed. Data are presented as mean values±SD. HNSCC, head and neck squamous cell carcinoma. * indicates p < 0.05, ** indicates p < 0.01, *** indicates p < 0.001, and **** indicates p < 0.0001.
Image
Figure Caption
Acknowledgments
This image is the copyrighted work of the attributed author or publisher, and
ZFIN has permission only to display this image to its users.
Additional permissions should be obtained from the applicable author or publisher of the image.
Full text @ J Immunother Cancer

