
|
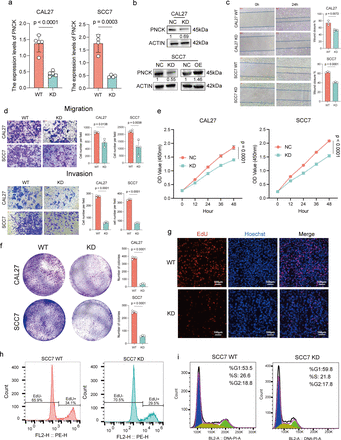
Fig. 2 Cellular-level validation of PNCK promoting malignant biological behaviors in HNSCC. (a) RT-qPCR verification of PNCK knockdown efficiency. A two-tailed unpaired Student’s t-test was performed. Data are presented as mean values±SD. (b) Western blot verification of PNCK knockdown and overexpression efficiency. The numbers below each panel represent the relative protein expression, with the NC group set to 1. (c) A scratch assay was performed to assess cell migration. The wound healing was monitored and quantified using a two-tailed unpaired Student’s t-test. Data are presented as mean values±SD. (d) Transwell migration and invasion assays were conducted to evaluate the migratory and invasive capabilities of HNSCC cells with altered PNCK expression, using a two-tailed unpaired Student’s t-test. Data are presented as mean values±SD. (e) Cell proliferation was assessed using the CCK8 assay. Two-way ANOVA with Tukey’s multiple comparison test. Data are presented as mean values±SD. (f) The ability of HNSCC cells to form colonies was evaluated using a colony formation assay, using a two-tailed unpaired Student’s t-test. Data are presented as mean values±SD. (g) EdU incorporation assay was performed to detect proliferating cells. Blue represents cell nuclei stained with Hoechst, and red represents EdU-positive cells; scale bar: 100 µm. (h) Flow cytometry was used to quantify EdU-positive cells. (i) The cell cycle distribution of HNSCC cells with altered PNCK expression was analyzed by flow cytometry. ANOVA, analysis of variance; HNSCC, head and neck squamous cell carcinoma.