
Image
|
Figure Caption
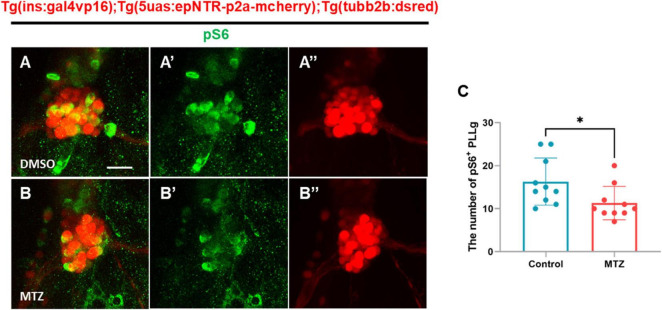
FIGURE 6
Depletion of insulin production downregulates the mTOR signaling pathway in the PLLg in ins:epNTR-mCherry zebrafish.
Acknowledgments
This image is the copyrighted work of the attributed author or publisher, and
ZFIN has permission only to display this image to its users.
Additional permissions should be obtained from the applicable author or publisher of the image.
Full text @ Front. Cell. Neurosci.