
Fig. 6
- ID
- ZDB-IMAGE-241016-46
- Publication
- Zareba et al., 2024 - NPC1 links cholesterol trafficking to microglial morphology via the gastrosome
- All Figures
- Figures for Zareba et al., 2024
|
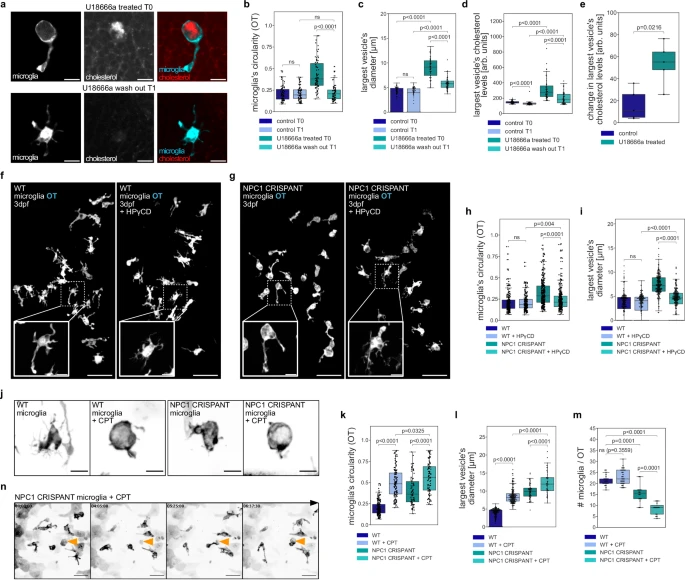
Fig. 6 NPC deficient microglia are sensitive to elevated neuronal cell death.a Representative images from U18666a treated (T0) OT microglia (TgBAC(csf1ra:GAL4-VP16), Tg(UAS-E1B:NTR-mCherry)) and from wash out (T1) with TopFluor cholesterol. Scale bar 10 µm. b–e Measurements from control T0 (N = 5, n = 76), control T1 (N = 5, n = 76), U18666a treated T0 (N = 5, n = 71) and U18666a wash out T0 (N = 5, n = 71) zebrafish with TopFluor cholesterol of OT microglia circularity (b), quantification of the largest vesicle’s diameter (c), quantification of the largest’s vesicle cholesterol levels (d) and its changes per individual zebrafish brains (e). f, g Representative images of zebrafish OT microglia (TgBAC(csf1ra:GAL4-VP16), Tg(UAS-E1B:NTR-mCherry)) from HPγCD experiment. Scale bar 50 µm. Examples of single microglia in boxes. Scale bar 10 µm. h, i Measurements from wild-type (N = 10, n = 201), wild-type treated with HPγCD (N = 10, n = 191), NPC1 CRISPANT (N = 18, n = 291) and NPC1 CRISPANT treated with HPγCD (N = 18, n = 291) zebrafish of OT microglia circularity (h) and quantification of the largest vesicle’s diameter (i). j Representative images of OT microglia (TgBAC(csf1ra:GAL4-VP16), Tg(UAS-E1B:NTR-mCherry)) from Camptothecin (+ CPT) experiment. Scale bar 10 µm. k Circularity of OT microglia from wild-type (N = 10, n = 198), wild-type treated with CPT (N = 10, n = 123), NPC1 CRISPANT (N = 8, n = 84) and NPC1 CRISPANT treated with CPT (N = 15, n = 95) zebrafish. l Quantification of the largest vesicle’s diameter in wild-type (N = 10, n = 218), wild-type treated with CPT (N = 10, n = 221), NPC1 CRISPANT (N = 8, n = 80) and NPC1 CRISPANT treated with CPT (N = 9, n = 66) zebrafish OT microglia. m Number of OT microglia (TgBAC(csf1ra:GAL4-VP16), Tg(UAS-E1B:NTR-mCherry)) in wild-type (N = 23), wild-type treated with CPT (N = 31), NPC1 CRISPANT (N = 16), NPC1 CRISPANT treated with CPT (N = 15) zebrafish. n Representative images of OT microglia (TgBAC(csf1ra:GAL4-VP16), Tg(UAS-E1B:NTR-mCherry)) treated with CPT. Left side of Supplementary Movie 7. Dying cell and its subsequent engulfment indicated by orange arrowhead. Scale bar 40 µm. N refers to the number of zebrafish embryos and n to the number of microglia examined. Boxplots represent the median value and interquartile range; the ends of the whiskers correspond to the minimum and maximum values. Statistical tests: Mann-Whitney-Wilcoxon test two-sided with Bonferroni correction. ns without any additional p-value on the graph stands for p = 1. OT stands for optic tectum and CPT stands for Camptothecin. Source data are provided as a Source Data file.