
Image
|
Figure Caption
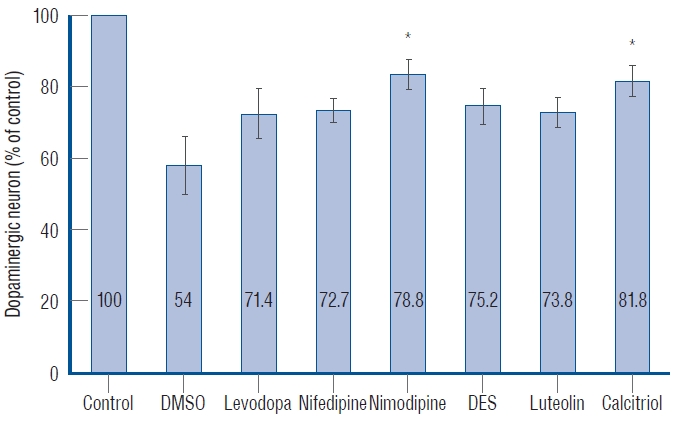
Fig. 6 Quantitative analysis of dopaminergic neurons in Tg(dat:EGFP) zebrafish ventral diencephalon. Data are expressed as a percentage of the control group. Each bar represents mean±standard deviation. *p<0.05 vs. the MPTP followed by DMSO-treated group. DMSO : dimethylsulfoxide, DES : diethylstilbestrol.
Acknowledgments
This image is the copyrighted work of the attributed author or publisher, and
ZFIN has permission only to display this image to its users.
Additional permissions should be obtained from the applicable author or publisher of the image.
Full text @ J Korean Neurosurg Soc