
|
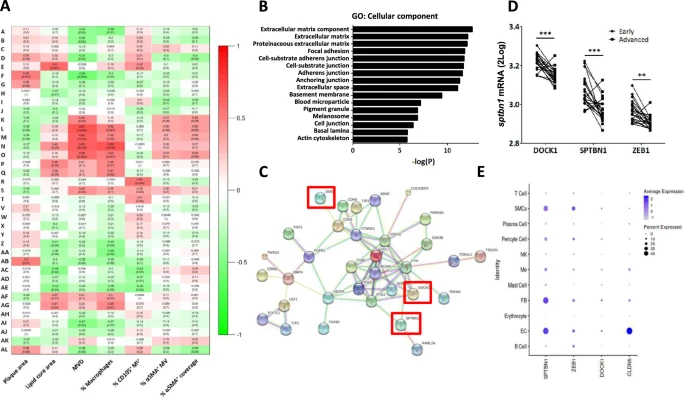
Fig. 2 Microarray analysis shows clear correlation of MVD with specific modules, which are enriched for GO terms related to endothelial junctions and cytoskeletal organization. A Heatmap of the module-trait correlations, showing upregulated (red) or downregulated (green) gene modules in relation to phenotypic traits in advanced unstable lesions. A high overlap in genetic profile was found for microvessel density (MVD) and lesional macrophage content (% Macrophages), while the percentage angiogenic endothelium (% CD105+ MV) showed a different expression profile. αSMA parameters showed certain overlap with MVD but failed to show highly enriched modules. Values of the Pearson's r coefficient and associated p-values (in parenthesis) are reported. B GO analysis on the overrepresented module shows a clear enrichment of biological processes related to endothelial cell adhesion, endothelial junctions, and extracellular matrix and cytoskeletal organization. C PPI network reconstruction for the most central and interconnected gene members of the MVD correlated module L revealed a network which included several known endothelial key proteins. Highlighted are the three hub genes showing the highest ranks based on ranking analysis, which were selected for further study: zeb1, sptbn1 and dock1 (enboxed). D Interrogation of single cell RNASEq dataset of Alsaigh et al. [20] revealed preferential expression of sptbn1 and to a lesser extent zeb1 and dock1 by plaque endothelial cells. Average expression is color coded (white to blue), node size reflects % of cells with target gene expression. The profile of the endothelial signature gene cldn5 profile is added to serve as reference