
Fig. 4
- ID
- ZDB-IMAGE-240802-4
- Antibodies
- Publication
- Tanaka et al., 2024 - Latrophilin-2 mediates fluid shear stress mechanotransduction at endothelial junctions
- All Figures
- Figures for Tanaka et al., 2024
|
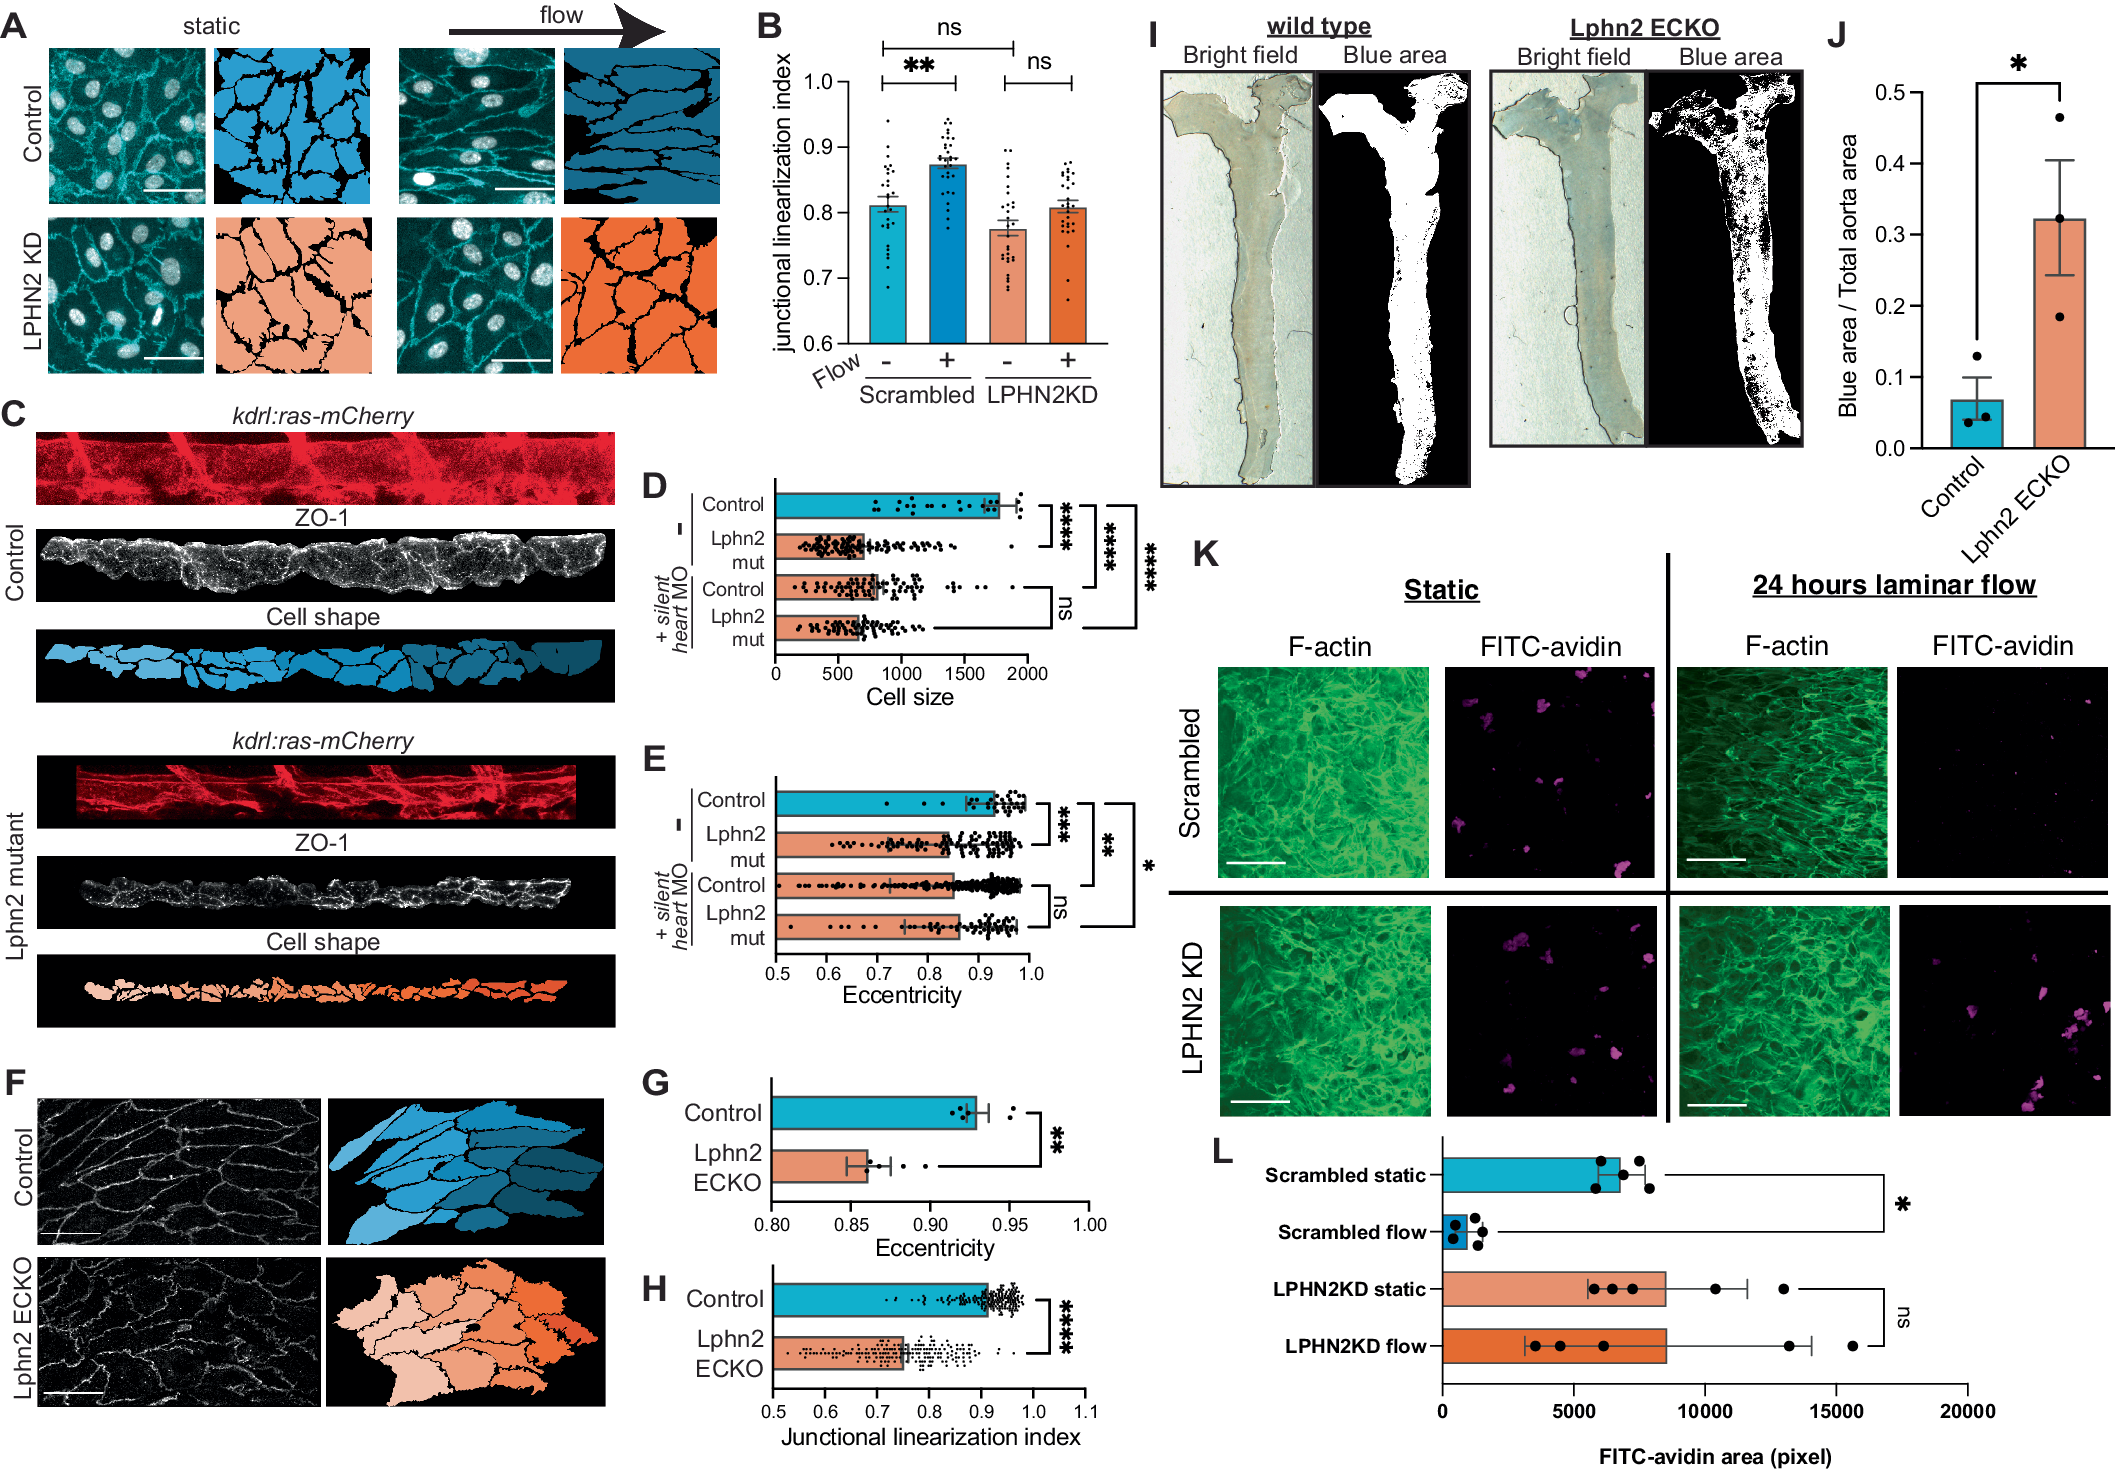
Fig. 4 Latrophilins in flow-mediated endothelial cell morphology in vivo. (A) Representative image of HUVECs transfected with scrambled siRNA or LPHN2 siRNA. Outlines of ECs from VE-cadherin staining are shown to next to each image. Scale bar: 100 µm. (B) Quantification of junctional linearization index from (A). n = 30 for each condition. **P = 0.0019, Statistics used two-way ANOVA with Sidak’s multiple comparison test. (C) Dorsal aortas from 48 hpf Tg(kdrl:ras-mCherry) WT or LPHN mutant zebrafish embryos stained for ZO-1. EC were outlined as in Methods. LPHN2 mutant indicates adgrl2a+adgrl2b.1 sgRNAs. (D, E) Quantification of cell size and eccentricity in embryos with latrophilin-2 CRISPR sgRNAs ± silent heart morpholinos (MO). N = 6 per condition. ****P < 0.0001, *P = 0.0267, **P = 0.0015, ***P = 0.0008; one-way ANOVA with Tukey’s multiple comparisons test. (F) ECs in the thoracic aorta in 18-week-old mice at 10 weeks after tamoxifen injections, stained for β-catenin (left) and outlined (right). Data are representative of 6 mice for each condition. Scale bar: 100 µm. (G, H) Quantification of cell eccentricity and junction linearity in mouse aorta. N = 4 per condition. **P = 0.0013; ****P < 0.0001; Student’s t test. (I) Aortas from mice 30 min after Evans blue dye injection, thresholded images on the right. The fractional blue area quantified in (J). n = 3 for each condition. *P = 0.0419; Student’s t test. (K) In vitro endothelial permeability assay using FITC–streptavidin and biotin-conjugated fibronectin. Scale bar: 100 µm. (L) Permeability was quantified by measuring FITC–streptavidin area per image field from (K). n = 5, *P = 0.0457, one-way ANOVA.