
Image
|
Figure Caption
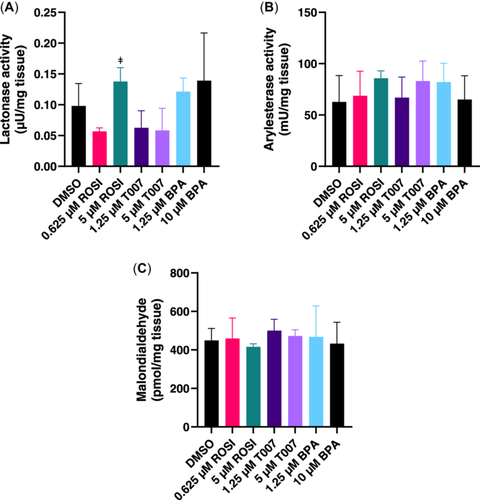
Fig. 2 Whole-embryo paraoxonase 1 (PON1) lactonase activity, PON1 arylesterase activity, and malondialdehyde levels. Data represent mean ± SD of (A) PON1 lactonase activity (n = 4), (B) PON1 arylesterase activity (n = 4), (C) Malondialdehyde levels (n = 4). ‡Statistically significant difference between the two tested concentrations of the same compound. DMSO = dimethyl sulfoxide (solvent control); ROSI = rosiglitazone; T007 = T0070907; BPA = bisphenol A.
Acknowledgments
This image is the copyrighted work of the attributed author or publisher, and
ZFIN has permission only to display this image to its users.
Additional permissions should be obtained from the applicable author or publisher of the image.
Full text @ Environ. Toxicol. Chem.