
Fig. 6
- ID
- ZDB-IMAGE-240725-14
- Genes
- Publication
- Yu et al., 2024 - Loss of function of Vasoactive-intestinal peptide alters sex ratio and reduces male reproductive fitness in zebrafish
- All Figures
- Figures for Yu et al., 2024
|
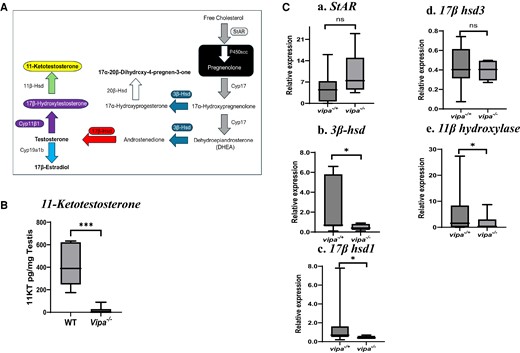
Fig. 6 The effect of loss of vipa on androgen synthesis and sex steroid hormone levels. (A) Schematic diagram of androgen synthesis pathway in Leydig cells in teleost (Adopted from (63). Each enzyme is signified by a color-coded arrow. (B) 11-Ketotestosterone levels in WT and vipa−/− male testes. (C) Comparison of the expression of genes encode for steroid synthesis enzymes in vipa−/+ and vipa−/− male siblings. (a) StAR, (b) 3β-hsd, (c) 17β-hsd1, (d) 17β-hsd3, (e) 11β-hydroxylase (cyp11β1 or cypc1). Results are presented as mean relative expression ± standard error of mean normalized using NORMA-Gene platform with 7 different genes for the gene expression study. 11-KT levels are presented as pg/mg testis using pairwise analysis with nonparametric statistical analysis. Statistical significance was accepted when P ≤ .05.