
Image
|
Figure Caption
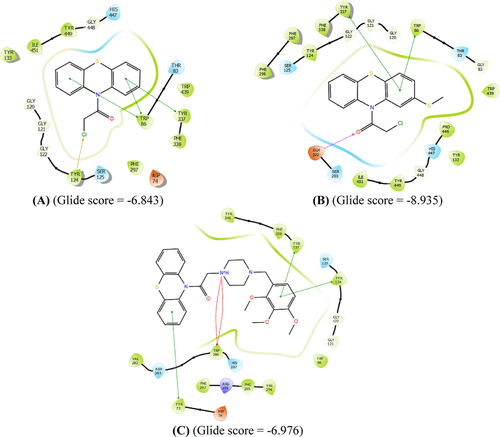
Fig. 5 Interaction profiles of the most potent ligands 1 (A), 3 (B), and 8 (C) against HCC cell lines. Purple color represents H-bond interactions, whereas red elliptic line defines Pi-cation interaction. In addition, green lines represent Pi–Pi interactions, and gold arrow is for the halogen bond interaction.
Acknowledgments
This image is the copyrighted work of the attributed author or publisher, and
ZFIN has permission only to display this image to its users.
Additional permissions should be obtained from the applicable author or publisher of the image.
Full text @ ACS Omega