
Image
|
Figure Caption
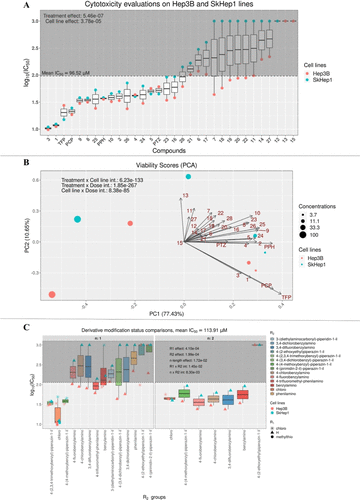
Fig. 2 Changes in cell viability upon exposure to the derivatives in Hep3B and SkHep1 cells. (A) Known and novel derivatives’ IC50 values; (B) PCA on cell viabilities across different doses of drugs; and (C) side-chain modifications by the intermediary and novel derivatives and their influences on the IC50 levels. Significance levels (p-values) are derived from n-way ANOVA for each respective comparison in R environment.
Acknowledgments
This image is the copyrighted work of the attributed author or publisher, and
ZFIN has permission only to display this image to its users.
Additional permissions should be obtained from the applicable author or publisher of the image.
Full text @ ACS Omega