
IMAGE
Fig. 3
- ID
- ZDB-IMAGE-240702-6
- Publication
- Benoit et al., 2023 - Noradrenergic tone is not required for neuronal activity-induced rebound sleep in zebrafish
- All Figures
- Figures for Benoit et al., 2023
Image
|
Figure Caption
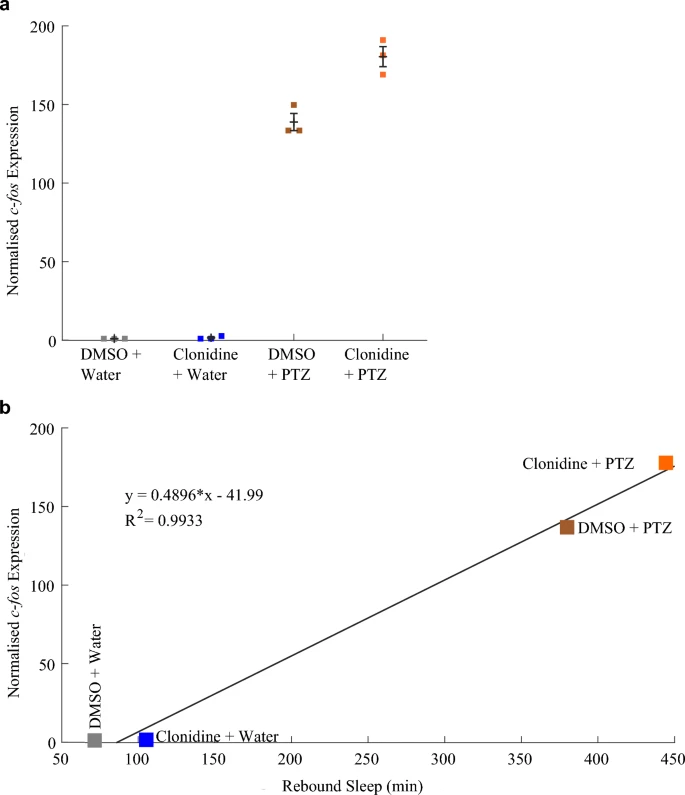
Fig. 3 Rebound sleep levels correlate with c-fos expression across different clonidine/PTZ treatment combinations. a qRT-PCR on groups of ~ 17 larvae (n = 3 biological replicates per condition) reveals that larvae treated with both clonidine and PTZ had a trend towards higher c-fos expression than those treated with PTZ alone (see also Fig. S4a). b The mean c-fos expression induced by each drug combination is strongly positively correlated (R2 = 0.993) with the amount of rebound sleep induced by each drug condition (see Fig. 1c and d). Each square in a is the mean of three technical replicates
Acknowledgments
This image is the copyrighted work of the attributed author or publisher, and
ZFIN has permission only to display this image to its users.
Additional permissions should be obtained from the applicable author or publisher of the image.
Full text @ J. Comp. Physiol. B