
Fig. 5
- ID
- ZDB-IMAGE-240702-42
- Publication
- Etchegaray et al., 2022 - The neurodevelopmental gene MSANTD2 belongs to a gene family formed by recurrent molecular domestication of Harbinger transposons at the base of vertebrates
- All Figures
- Figures for Etchegaray et al., 2022
|
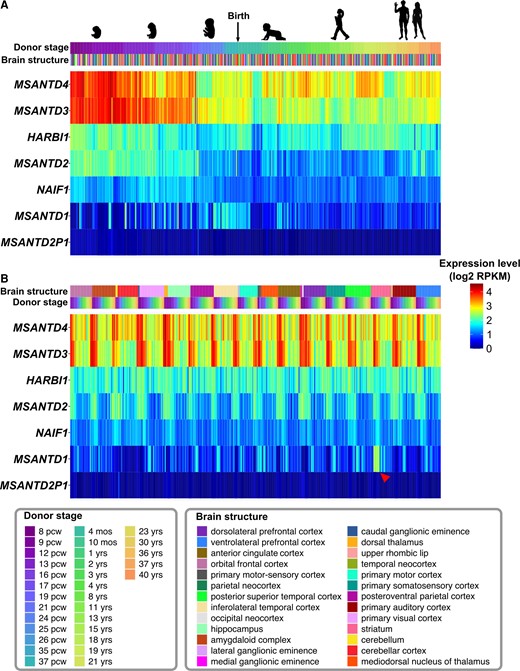
Fig. 5 Expression of Harbinger-derived genes in human brain before and after birth according to donor stages (A) or brain structures (B). For each gene, the expression is shown in log2 reads per kilobase per million (RPKM) for different donor stages (pcw, postconceptional weeks; mos, months; yrs, years) and in different brain structures, represented with multiple colors. Data were obtained from the BrainSpan Atlas (www.brainspan.org) (Miller et al. 2014). The striatum-specific expression of MSANTD1 is indicated with a red arrowhead. Silhouette images are from lifesizesilhouette.com and (Haniffa et al. 2021).