
|
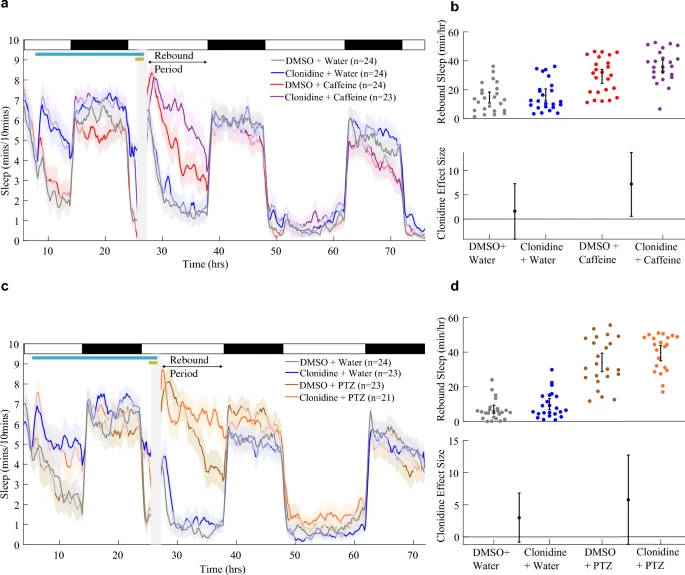
Fig. 1 Activating α2-adrenoceptors during drug-induced arousal facilitates rebound sleep. a Sleep traces (± SEM) beginning at 5 dpf and continuing over three days and nights (time since ZT0 at 5 dpf) for larvae exposed to combinations of 5 µM clonidine/DMSO and 2 mM caffeine/water. Following drug wash-off, larvae experience rebound sleep (labelled Rebound Period). At the top, white and black bars represent day and night, respectively; the pale blue horizontal bar shows the clonidine exposure window, while the gold bar indicates the presence of stimulant. b Upper chart shows the average total sleep/h during the rebound period for each larva (black bar: mean and 95% CI). Lower chart shows the effect size (with 95% CI) of clonidine treatment on boosting rebound sleep/h among water-treated and caffeine-treated groups. c Sleep traces as in a for larvae exposed to combinations of clonidine and 10 mM PTZ. The post-drug rebound sleep period of c is summarised for each larva in d (upper chart). Lower chart shows the effect size (with 95% CI) of clonidine treatment on boosting rebound sleep/h among water-treated and PTZ-treated groups