
|
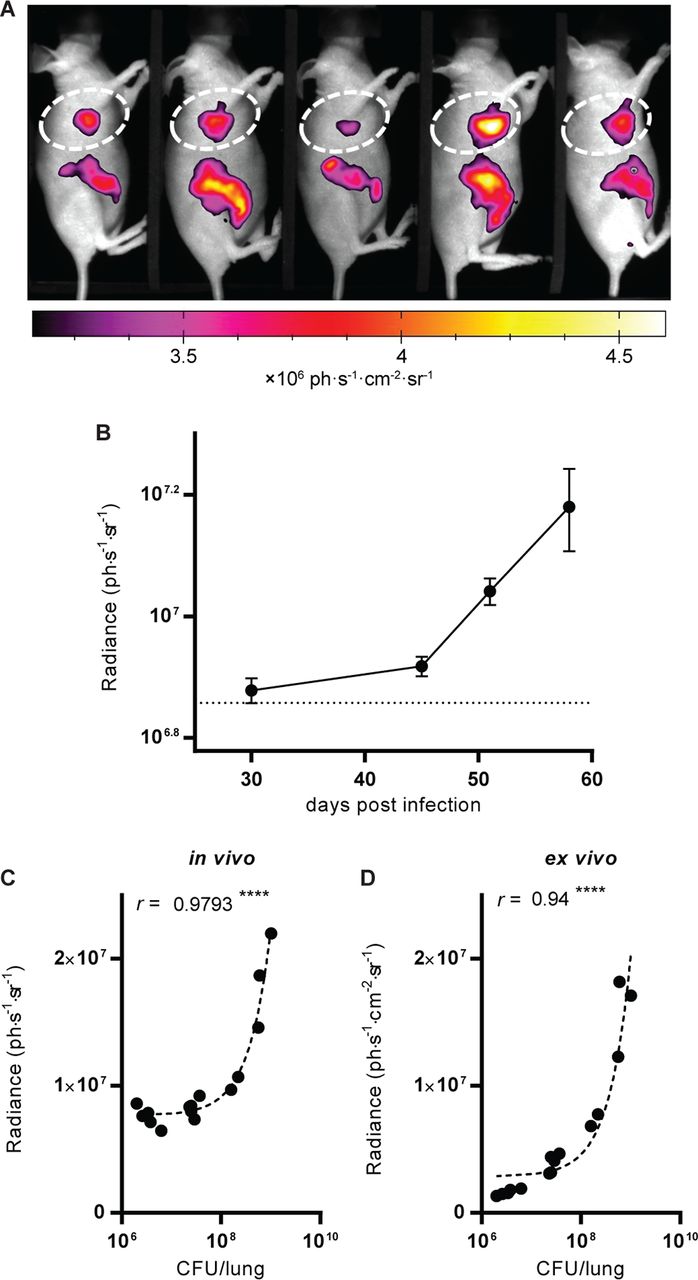
Fig. 4 Visualization and quantification of NIR fluorescence in living infected animals. (A) One group of mice analyzed at 45 dpi with NIR fluorescence. The picture is a black-and-white photograph, and the NIR fluorescent signal is overlaid in false color. The quantified zone in the thorax is delimited by dashed lines, and the results obtained at 45 dpi are reported in panel B. (B) Quantification of the fluorescence intensity in the thorax of different groups of mice at the time points indicated. Data show the averages ± SEM. The dotted line indicates the average background fluorescence level measured in uninfected mice. For all time points, data are for 5 mice per group. (C, D) The number of CFU recovered from the lungs of mice at 30, 45, and 58 dpi correlates with the fluorescence measured and quantified in vivo (C) and ex vivo on excised lungs (D). r is the Pearson correlation coefficient. ****, P < 0.0001. The dashed lines are linear regressions.