
Image
|
Figure Caption
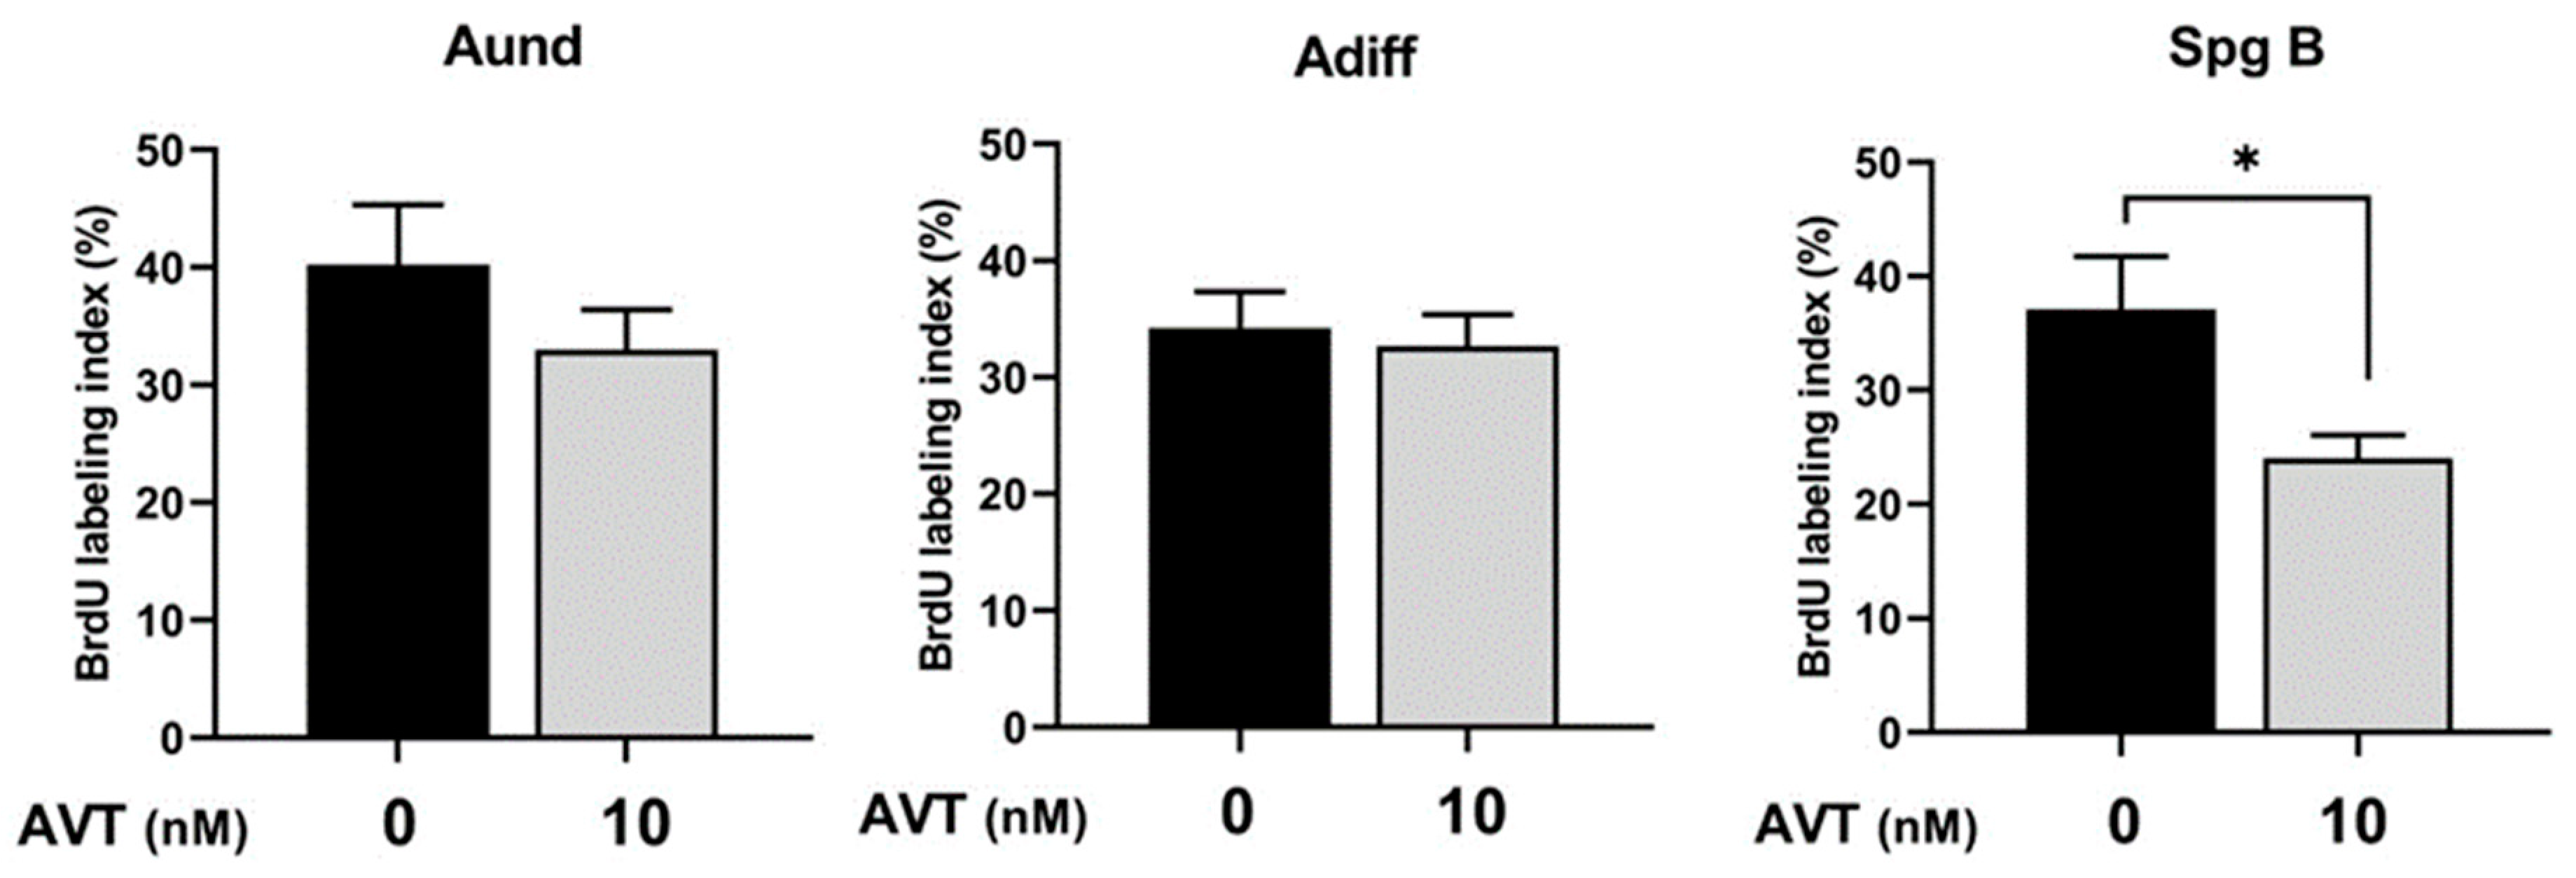
Fig. 3 BrdU-labeling index of Aund, Adiff, and type B spermatogonia in basal conditions and in the presence of AVT (10 nM). BrdU was incorporated during the last 6 h of 7-day ex vivo testis culture. Bars show the mean ± SEM. Asterisks represent significant differences between treatment and control, analyzed by Student’s t-test (n = 5–7), p < 0.05.
Acknowledgments
This image is the copyrighted work of the attributed author or publisher, and
ZFIN has permission only to display this image to its users.
Additional permissions should be obtained from the applicable author or publisher of the image.
Full text @ Int. J. Mol. Sci.