IMAGE

Fig. 3

ID
ZDB-IMAGE-240614-49
Source
Figures for Miles et al., 2024
Image
Figure Caption

Fig. 3 
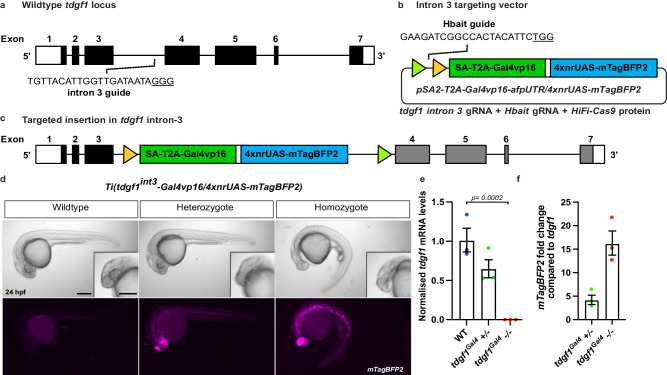
Site-specific integration of targeting vector into tdgf1.

a Schematic of tdgf1 gene structure and location of the intron 3 guideRNA target site. b The pSA2-Gal4vp16/4xnrUAS-mTagBFP2 targeting vector, FRT and FRT3 sites are indicated by triangles. c Successful integration of the targeting plasmid to generate the Ti(tdgf1int3-Gal4vp16/4xnrUAS-mTagBFP2) targeted insertion line. d Brightfield and fluorescent images of Ti(tdgf1int3-Gal4vp16/4xnrUAS-mTagBFP2) targeted insertion line demonstrating loss of tdgf1 phenotypes in homozygote mutants at 24 hpf. mTagBFP2 fluorescence is false-coloured magenta. Scale bars = 250 μm. e, f mRNA expression analysis at 24 hpf demonstrates loss of tdgf1 in homozygote mutants (e) and the fold increase of mTagBFP2 expression levels compared to native tdgf1 from Gal4/UAS amplification (f). Error bars represent SEM for n = 3 independent biological replicates, each consisting of a pooled sample of 14 or 16 embryos. rpl13 and ef1α were used as the reference genes. Source data are provided as a Source Data file. Statistical differences were determined using a two-tailed unpaired t-test.

Acknowledgments
This image is the copyrighted work of the attributed author or publisher, and ZFIN has permission only to display this image to its users. Additional permissions should be obtained from the applicable author or publisher of the image. Full text @ Nat. Commun.