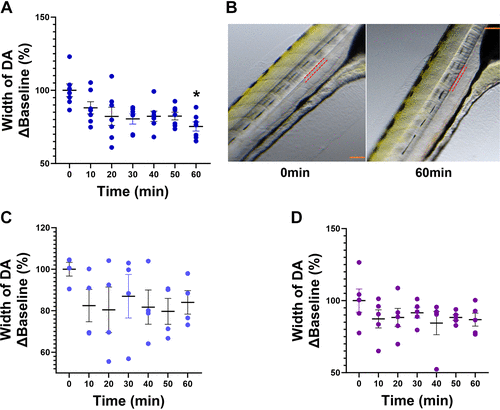
Fig. 3 Effects of sodium butyrate, sodium acetate, and sodium propionate on vascular tone in anesthetized zebrafish larvae. A: 2.2 µM sodium butyrate produced a significant decrease in the cross-sectional width of the dorsal aorta (DA) at 60 min. B: red dotted lines mark the outline of the DA at baseline (0 min, left) and at 60 min (right) following exposure to sodium butyrate. Scale bar in orange = 200 µm. C and D: 27.4 µM acetate (C) and 1.7 µM propionate (D) produced no change. Data are presented as means ± SE and calculated as %Baseline (0 min). n = 5–8/treatment group. Repeated-measures one-way ANOVA with a Dunnett’s post hoc test; *P < 0.05.
Image
Figure Caption
Acknowledgments
This image is the copyrighted work of the attributed author or publisher, and
ZFIN has permission only to display this image to its users.
Additional permissions should be obtained from the applicable author or publisher of the image.
Full text @ Physiol. Genomics

