
IMAGE
Fig. 1
- ID
- ZDB-IMAGE-240607-6
- Publication
- Lu et al., 2024 - Developmental dopaminergic signaling modulates neural circuit formation and contributes to autism spectrum disorder (ASD)-related phenotypes
- All Figures
- Figures for Lu et al., 2024
Image
|
Figure Caption
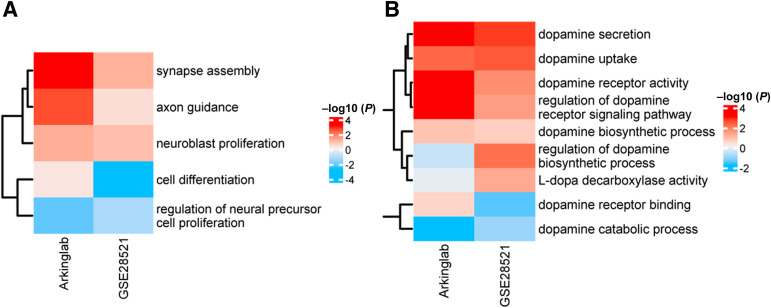
Fig. 1 A and B: Expression changes in development-related gene sets (A) and dopaminergic gene sets (B) in the GSE28521 data set (https://www.ncbi.nlm.nih.gov/geo) and the Arkinglab data set (http://www.arkinglab.org/resources). Red depicts up-regulation, and blue denotes down-regulation. Gene expression changes with P < 0.05 are shown.
Acknowledgments
This image is the copyrighted work of the attributed author or publisher, and
ZFIN has permission only to display this image to its users.
Additional permissions should be obtained from the applicable author or publisher of the image.
Full text @ Am. J. Pathol.