
|
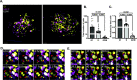
Fig. 4 In vivo visualization of T4888M cell cycle using the PIP-FUCCI reporter. (A) Representative 3D images of T4888 ATC cancer cells using the PIP-FUCCI reporter. Scale bar= 30 μm. (B) Graph showing total number of cells at 4 dpi in each cell cycle phase with the PIP-FUCCI reporter (T4888 n=22). (C) Graph showing cell cycle phases with the PIP-FUCCI reporter normalized by the total number of cells in T4888 ATC mass (T4888 n=22). (D-E) Images from 48-hour live imaging to highlight proliferative cells, imaging begins 1dpi and ends at 3dpi. Data is from at least two independent experimental replicates. Bar plots show mean ± SEM, each dot represents one larva, P-values are shown in each graph.