
Fig. 3
- ID
- ZDB-IMAGE-240607-19
- Publication
- Michael et al., 2024 - A zebrafish xenotransplant model of anaplastic thyroid cancer to study the tumor microenvironment and innate immune cell interactions in vivo
- All Figures
- Figures for Michael et al., 2024
|
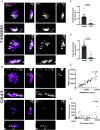
Fig. 3 T4888M ATC xenotransplants display high angiogenic ability. (A-B) Representative 3D images of ATC tumor mass and vessel recruitment at 4 dpi Tg(fli:GFP) in ATC cell lines T4888 and C643. Scale bar= 50 μm. (C) Graph showing vessel density in tumor mass normalized by tumor volume μm3 for ATC cell lines T4888 and C643 (T4888 n=26, C643 n=26). (D) Graph showing vessel density in tumor mass normalized by tumor area μm2 for ATC cell lines T4888 and C643 (T4888 n=26, C643 n=26). (E) Graph of the correlation between T4888 mass volume and T4888 vessel volume. (F) Graph of the correlation between C643 mass volume and C643 vessel volume (T4888 n=26, C643 n=26). Data is from at least two independent experimental replicates. Bar plots show mean ± SEM, each dot represents one larva, P-values are shown in each graph. Pearson correlation graphs show line of best fit; each dot represents one larva, r-values are shown in each graph.