
|
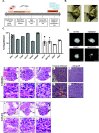
Fig. 1 ATC cell lines engraft in zebrafish larvae at different rates. (A) Experimental timeline for thyroid xenotransplant model. (B) Representative images acquired using the stereomicroscope at 2 dpf to show proper site of injection. (C) Graph showing percent engraftment for ATC mouse (N794, T1903, T1860, N2773, N2933, T4888M) and human (ACT1, BHT101, ASH3, C643) cell lines. (D) Representative images acquired using the fluorescent microscope at 4 dpi in mouse and human ATC cell lines. Scale bar= 100 μm (E-G & JL) Representative images of T4888 and C643 ATC cell lines in zebrafish. Scale bar= 20 μm. (E’-G’ & J’-L’) Higher magnification showcasing important histopathological features maintained in T4888 and C643 ATC zebrafish xenotransplants. Scale bar= 20 μm. (H & H’) Histopathological analysis from original lung metastasis of T4888 ATC cells in a murine mouse model ((Pten, P53)/−/−). Scale bar= 50 μm. (I & I’) Histopathological analysis from an allograft in a murine mouse model. Scale bar= 50 μm. Data is from at least two independent experimental replicates. Bar plots show mean ± SEM, each dot represents one experiment.