
|
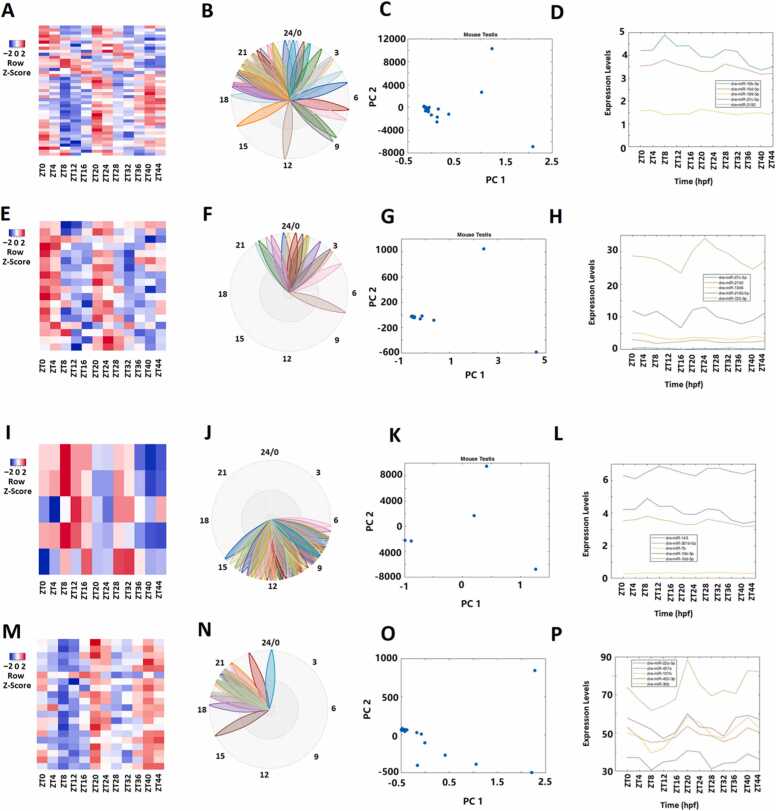
Fig. 4 Analyses of 43 rhythmically expressed zebrafish miRNAs. (A-D) Analysis of all the 4047 rhythmically expressed zebrafish miRNAs: Heat map (A) of all the 43 rhythmically expressed miRNAs, BioDare2 phase plots of all miRNAs (B), PCA analyses of all miRNAs with variances of PC1 99.73% and PC2 0.21% (C), and expression profiles of the representative miRNAs (D). (E-H) Analysis of 18 morning miRNAs: Heat map of the 18 morning miRNAs (E), BioDare2 phase plots of morning miRNAs (F), PCA analyses of the morning miRNAs with variances of PC1 99.94% and PC2 0.04% (G), and expression profiles of the representative miRNAs (H). (I-L) Heat map of the 5 evening miRNAs (I), BioDare2 phase plots of evening miRNAs (J), PCA analyses of the evening miRNAs with variances of PC1 99.56% and PC2 0.41% (K), and expression profiles of the representative miRNAs (L). (M-P) Heat map of the 20 night miRNAs (M), BioDare2 phase plots of the night miRNAs (N), PCA analyses of the night miRNAs with variances of PC1 99.85% and PC2 0.10% (O), and expression profiles of the representative mRNAs (P).