
Image
|
Figure Caption
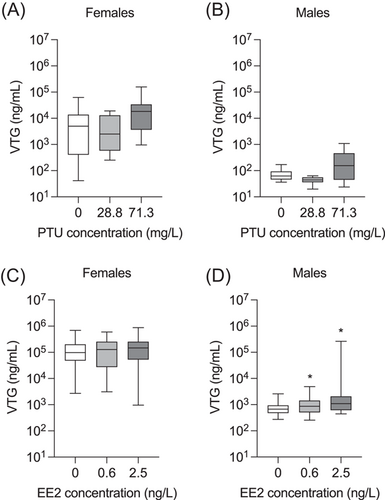
Fig. 5 Vitellogenin (VTG) levels in juvenile F1 zebrafish exposed to different concentrations of (A, B) PTU or (C, D) EE2 for 60 days. Data are given as means ± SD (n = 26–72 per treatment, three replicates of 5–22 individuals each). Significant differences between treatment groups and controls after 21 days exposure: *p < 0.05, **p < 0.01, ***p < 0.001. EE2, 17α-ethinylestradiol; PTU, 6-propyl-2-thiouracil
Acknowledgments
This image is the copyrighted work of the attributed author or publisher, and
ZFIN has permission only to display this image to its users.
Additional permissions should be obtained from the applicable author or publisher of the image.
Full text @ Integr. Environ. Assess. Manag.