IMAGE

Figure 1

ID
ZDB-IMAGE-240527-19
Source
Figures for Fieuws et al., 2024
Image
Figure Caption

Figure 1

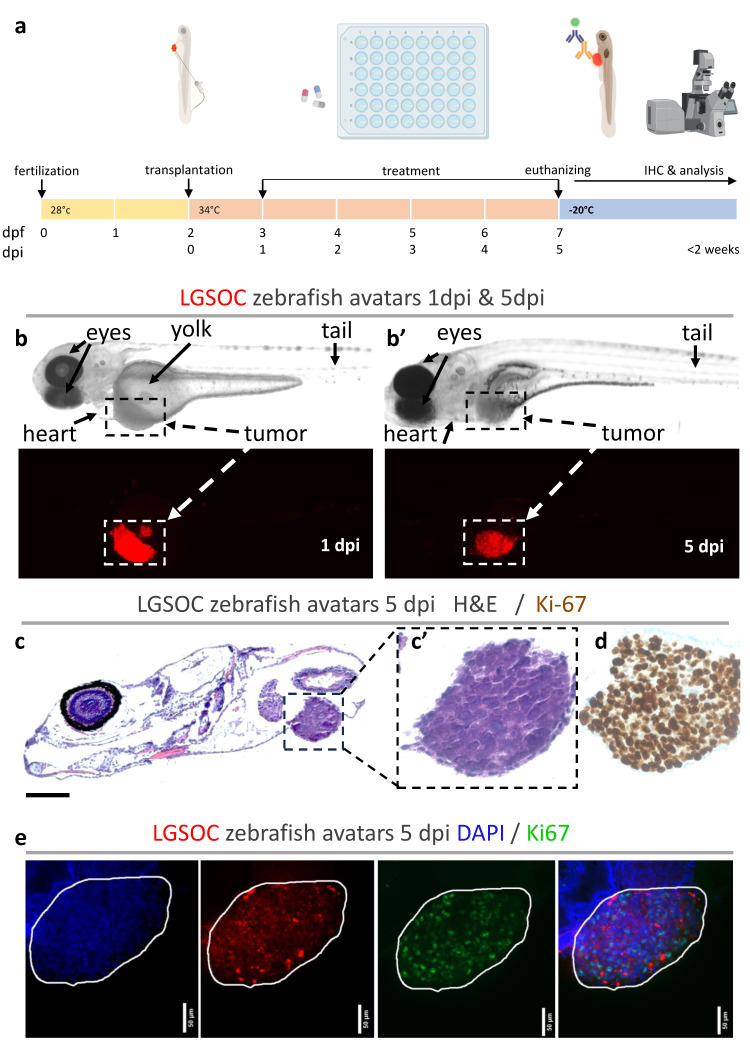
Establishment and analysis of zebrafish xenografts from LGSOC cells. (a) Schematic workflow for the generation of zebrafish xenografts from LGSOC cells. Early passage cell line was labeled with Vybrant CM-DiI dye (red) and microinjected in the PVS of 2 dpf larvae. One dpi larvae were screened and randomly distributed into treatment groups. After 96 h of treatment, xenografts were euthanized and divided for postmortem analysis based on immune staining. (b,b’) Assessment of tumor progression through live-cell imaging in zebrafish xenograft at 1 dpi and 5 dpi. Top row shows brightfield picture; bottom row shows RFP filter with tumor cells expressing red fluorescence. Anatomic structures are indicated in pictures; dashed box indicated tumor area. (c,c’) Hematoxylin eosin staining and (d) immunohistochemistry for Ki67 were performed in histological sections to observe morphology and proliferative capacity of the cancer cells in the zebrafish larvae. Dashed box indicates area of zoom. (e) Representative whole mount immunofluorescence staining for Ki67, all images are at 25× magnification (scale bar, 50 µm). Nuclei stained with DAPI in blue, anti-Ki67 in green and fluorescently labeled cancer cells in red. Tumor area is indicated with a white line. All images are anterior to the left, dorsal up.

Acknowledgments
This image is the copyrighted work of the attributed author or publisher, and ZFIN has permission only to display this image to its users. Additional permissions should be obtained from the applicable author or publisher of the image. Full text @ Cancers