
|
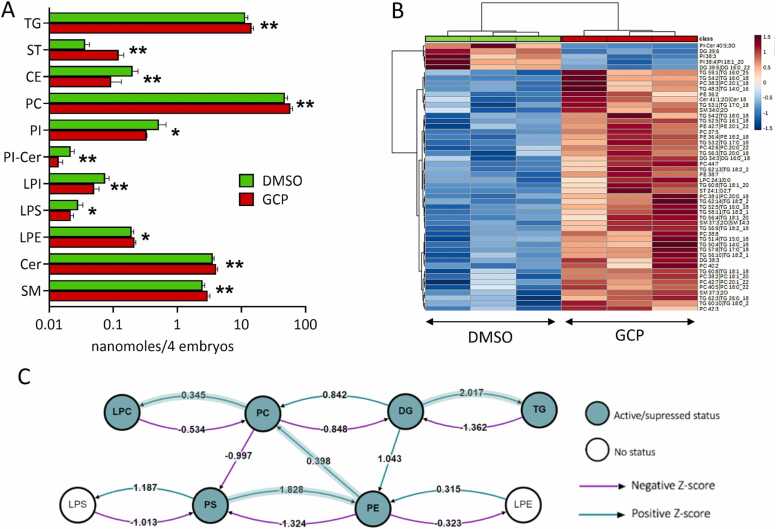
Fig. 3 Effect of GCP on the lipid profile of zebrafish embryos. A) Levels of the different classes of lipids detected in DMSO and GCP-treated embryos. Embryos were treated at the 1–2 cell stage and lipid analysis was performed at 96 hpf. Data are expressed as nanomoles/pool of 4 embryos. * , P < 0.1; * *, P < 0.05, Student’s t test. B) Heatmap showing hierarchical clustering of the lipid species between GCP-treated zebrafish embryos and control animals (DMSO). Only the 50 most important lipids species are displayed based on their t-test p-values. Color coding represents the -Log p-value. C) Lipid subclass correlation network of GCP-treated embryos compared to controls.