
IMAGE
Fig. 1
- ID
- ZDB-IMAGE-240515-18
- Publication
- Juliana et al., 2024 - Characterization of the zebrafish as a model of ATP-sensitive potassium channel hyperinsulinism
- All Figures
- Figures for Juliana et al., 2024
Image
|
Figure Caption
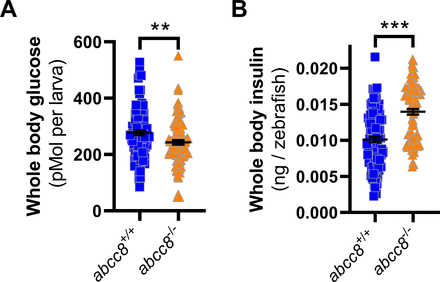
Fig. 1 Zebrafish larvae whole body glucose and insulin. (A) Whole body glucose measurements of abcc8+/+ control (95% CI 259.4, 294.2) and abcc8-/- (95% CI 226.9, 259.3) larvae (5 days post-fertilization (dpf)) (p=5.5×10⁻³, n=100). (B) Evaluation of whole body insulin in abcc8+/+ control (95% CI 0.009, 0.01) and abcc8-/- (95% CI 0.013, 0.014) zebrafish larvae (5 dpf) (p=4.4×10⁻¹¹, n=100). **p=5.5×10⁻³; ***p=4.4×10⁻¹¹. Data represent mean±SEM
Figure Data
Acknowledgments
This image is the copyrighted work of the attributed author or publisher, and
ZFIN has permission only to display this image to its users.
Additional permissions should be obtained from the applicable author or publisher of the image.
Full text @ BMJ Open Diabetes Res Care