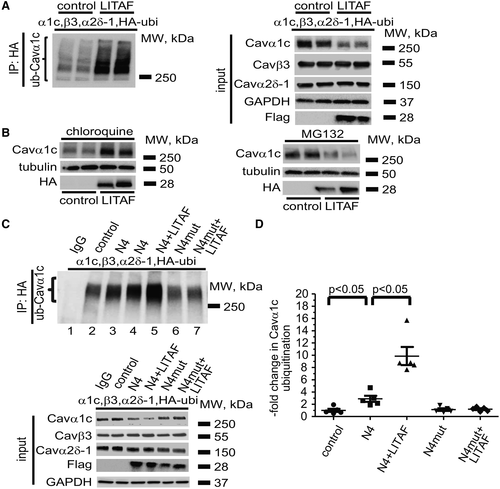
Fig. 6 LITAF (lipopolysaccharide-induced tumor necrosis factor)-mediated ubiquitination and degradation of Cavα1c (L-type calcium channel alpha-1C subunit) in tsA201 cells. Cells were transfected with plasmids for Cavα1c, Cavβ3, and Cavα2δ-1, HA (hemagglutinin)-tagged ubiquitin (HA-ubi), GFP (green fluorescence protein) as control, or Flag-tagged LITAF. Immunoprecipitation (IP) of lysates from transfected cells was performed with anti-HA antibody. A, A representative immunoblot shows levels of ubiquitinated Cavα1c ( left) and input levels of Cavα1c, Cavβ3, Cavα2δ-1, Flag-tagged LITAF, and GAPDH ( right). B, LITAF-mediated degradation of Cavα1c through lysosomes. Cells were transfected with plasmids for Cavα1c, Cavβ3, and Cavα2δ-1, GFP as control, or HA-tagged LITAF for 24 h and then treated with 10 µM chloroquine or 5 µM MG132 (N-benzyloxycarbonyl-L-leucyl-L-leucyl-L-leucinal) for 20 h. Representative Western blots show total abundance of Cavα1c and tubulin of treated cells. C, IP of lysates from cells transfected with plasmids for Cavα1c, Cavβ3, and Cavα2δ-1, HA-tagged ubiquitin, GFP as control, NEDD (neural precursor cell expressed developmentally down-regulated protein) 4-1 (N4), NEDD4-1-C867A (N4mut), or Flag-tagged LITAF was performed with anti-HA antiserum. A representative immunoblot shows levels of ubiquitinated Cavα1c ( top) and input levels of Cavα1c, Cavβ3, Cavα2δ-1, Flag-tagged LITAF, and GAPDH ( bottom). D, Respective changes in the level of ubiquitinated Cavα1c, normalized to total Cavα1c (5 experiments, performed in duplicate; mean±SEM). Student t test, P<0.05.
Image
Figure Caption
Acknowledgments
This image is the copyrighted work of the attributed author or publisher, and
ZFIN has permission only to display this image to its users.
Additional permissions should be obtained from the applicable author or publisher of the image.
Full text @ Circ Genom Precis Med

