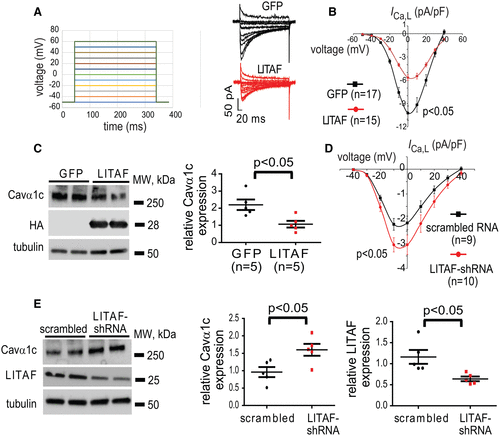
Fig. 3 Control of LTCC current (ICa,L) and Cavα1c (L-type calcium channel alpha-1C subunit) protein levels by LITAF (lipopolysaccharide-induced tumor necrosis factor) in 3-wk-old cardiomyocytes. Cardiomyocytes were transduced with adenovirus encoding GFP (green fluorescence protein) or HA (hemagglutinin)-LITAF for 48 h. A, Left, voltage steps to measure I-V for ICa,L. Right, representative recordings of ICa,L in cardiomyocytes. B, Voltage dependence of ICa,L current density in cardiomyocytes transduced with GFP or LITAF (cells from 5 animals; mean±SEM; Student t test, P<0.05). C, Protein levels of Cavα1c, HA-LITAF, and tubulin ( left). Respective change in Cavα1c abundance, normalized to tubulin (n=5 animals, performed in triplicate; mean±SEM). Student t test, P<0.05 ( right). D, Current-voltage relationships of ICa,L peak currents for baseline conditions from cells expressing scrambled RNA or short hairpin RNA (shRNA) against endogenous LITAF (cells from 5 animals; mean±SEM; Student t test, P<0.05). E, Protein levels of Cavα1c, total LITAF, and tubulin ( left). Respective changes in Cavα1c and LITAF abundance, normalized to tubulin (n=5 animals, performed in triplicate; right).
Image
Figure Caption
Acknowledgments
This image is the copyrighted work of the attributed author or publisher, and
ZFIN has permission only to display this image to its users.
Additional permissions should be obtained from the applicable author or publisher of the image.
Full text @ Circ Genom Precis Med

