
Image
|
Figure Caption
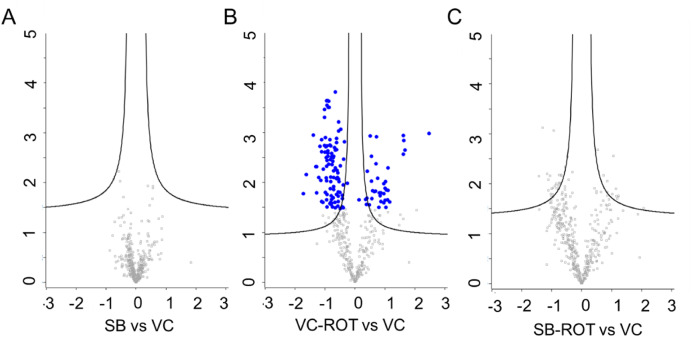
Fig. 5 Volcano plot of differentially expressed proteins (A) SB vs VC (B) VC-ROT vs VC, and (C) SB-ROT vs VC. Blue dots represent the differentially expressed proteins as compared to VC group. Statistical significance was carried out using student-t-test (p < 0.05) using Perseus software.
Acknowledgments
This image is the copyrighted work of the attributed author or publisher, and
ZFIN has permission only to display this image to its users.
Additional permissions should be obtained from the applicable author or publisher of the image.
Full text @ J Ayurveda Integr Med