
Image
|
Figure Caption
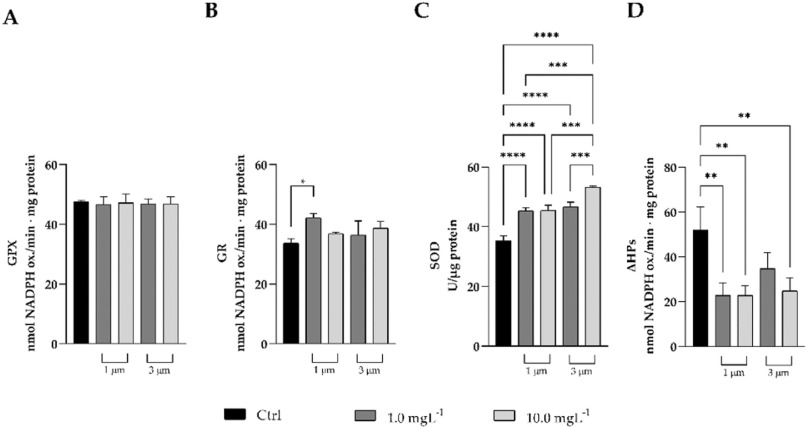
Fig. 6 Glutathione peroxidase activity (GPX, A), glutathione reductase activity (GR, B), superoxide dismutase activity (SOD, C), and in vitro susceptibility to oxidative stress (ΔHPs, D) in control larvae or larvae exposed to 1 µm or 3 µm PS-MPs. Each determination is the mean of three repeated measures (* p < 0.05; ** p < 0.01; *** p < 0.001; **** p < 0.0001).
Acknowledgments
This image is the copyrighted work of the attributed author or publisher, and
ZFIN has permission only to display this image to its users.
Additional permissions should be obtained from the applicable author or publisher of the image.
Full text @ Environ. Toxicol. Pharmacol.