
Image
|
Figure Caption
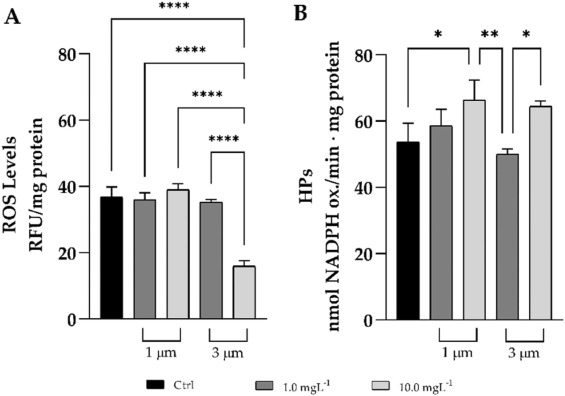
Fig. 5 Oxidative stress in control larvae or larvae exposed to 1 µm or 3 µm PS-MPs. (A) ROS content; (B) HPs, lipid hydroperoxide levels. Each determination is the mean of three repeated measures. Statistical differences were determined by ANOVA followed by Tukey's test (* p < 0.05; ** p < 0.01; *** p < 0.001; **** p < 0.0001).
Acknowledgments
This image is the copyrighted work of the attributed author or publisher, and
ZFIN has permission only to display this image to its users.
Additional permissions should be obtained from the applicable author or publisher of the image.
Full text @ Environ. Toxicol. Pharmacol.