
Image
|
Figure Caption
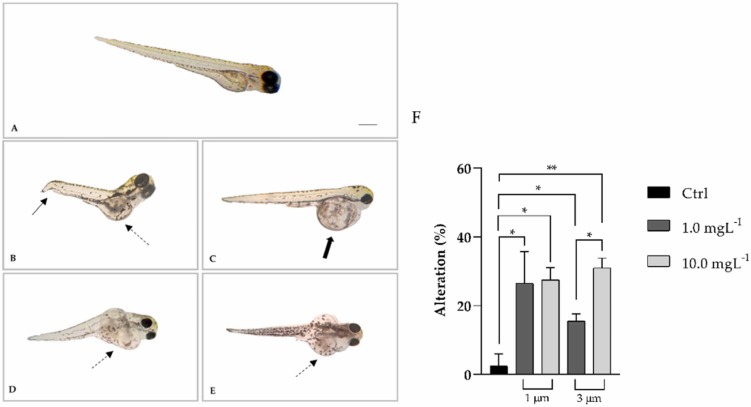
Fig. 1 Polystyrene PS-MPs induce marked dose-dependent phenotypic alterations. Control larva (A). Larvae treated with 1 µm PS-MPs at 1.0 (B) or 10.0 mgL-1 (C). Larvae treated with 3 µm PS-MPs at 1.0 (D) or 10.0 mgL-1 (E). Notice the bent tail (arrow), the cardiac edema (dotted arrow), yolk sac deformities (thick arrow). (F) Percentage of phenotypic alterations exposed to 1.0 or 10.0 mgL-1 of 1 or 3 µm PS-MPs. Statistical differences were determined by ANOVA followed by Tukey's test (* p < 0.05; ** p < 0.01). Scale bar: 450 µm.
Acknowledgments
This image is the copyrighted work of the attributed author or publisher, and
ZFIN has permission only to display this image to its users.
Additional permissions should be obtained from the applicable author or publisher of the image.
Full text @ Environ. Toxicol. Pharmacol.