
Image
|
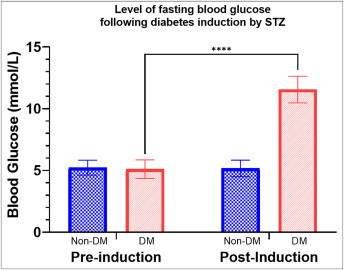
Figure Caption
Fig. 5 The differences of the fasting blood glucose level between the non-DM and DM groups during pre- and post-induction of diabetes. (n = 24, paired t-test).
Figure Data
Acknowledgments
This image is the copyrighted work of the attributed author or publisher, and
ZFIN has permission only to display this image to its users.
Additional permissions should be obtained from the applicable author or publisher of the image.
Full text @ Heliyon