
|
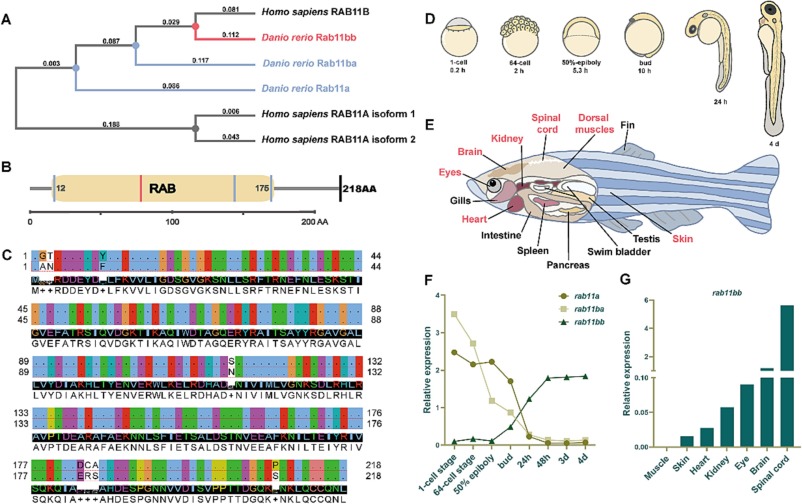
Fig. 2 Expression patterns of different Rab11 isoforms in zebrafish. (A) The phylogenetic tree with the maximum-likelihood algorithm. The number above the evolutionary branch represents the distance of homology. (B) Protein functional domain of RAB11B (Homo sapiens) and Rab11bb (Danio rerio). (C) Sequence alignment between RAB11B (Homo sapiens) and Rab11bb (Danio rerio). Above is RAB11B and below is Rab11bb. (D) The schematic diagram of developmental stages of zebrafish embryo after fertilization. (E) Anatomical diagram of adult zebrafish (red marked: tissues for subsequent experiment). (F) Line graph of qRT-PCR analysis of different Rab11 isoforms in zebrafish larvae at different developmental stages. The total RNA of each stage was obtained from 30 zebrafish larvae by three independent experiments. (G) Histogram of relative expression analysis of Rab11bb in adult zebrafish at different tissues. The total RNA of each tissue was obtained from 4 adult zebrafish by three independent experiments.