IMAGE

Fig. 5

ID
ZDB-IMAGE-240418-30
Source
Figures for Cheng et al., 2024
Image
Figure Caption

Fig. 5

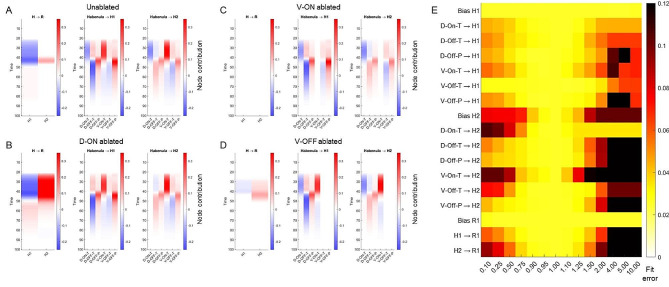
Contributions of each neural network node to the Raphe response. (A-D) Contributions (y-axis) of each NN node (x-axis) to the nodes in the successive layer over 100s (y-axis). In each panel, the leftmost column shows the contribution of H1 and H2 nodes to the Raphe output (after scaling by the respective Layer 2 weights). The middle panel shows the contribution of the six Habenula subtypes to the H1 node (after scaling by the respective Layer 1 weights), and the right most column shows the contribution of the same six habenula subtypes to the H2 node (after scaling by the respective Layer 1 weights). The contribution intensities are indicated by the color scheme ranging from negative/inhibition (blue) to positive/activation (red). (A) shows the node contributions in the unablated experiment, (B) in the D-ON ablation experiment, (C) in the V-ON ablated experiment and (D) in the V-OFF ablation experiment. In the ablation experiments, the contributions of the ablated neurons can be seen to be zero. (E) shows the sensitivity of the final estimated Raphe output to changes in each NN parameter. The intensities show the fit error computed as the RMSD between the model-estimated and observed Raphe responses across the unablated and three ablation experiments

Acknowledgments
This image is the copyrighted work of the attributed author or publisher, and ZFIN has permission only to display this image to its users. Additional permissions should be obtained from the applicable author or publisher of the image. Full text @ BMC Neurosci.