IMAGE

Fig. 2

ID
ZDB-IMAGE-240418-28
Source
Figures for Cheng et al., 2024
Image
Figure Caption

Fig. 2

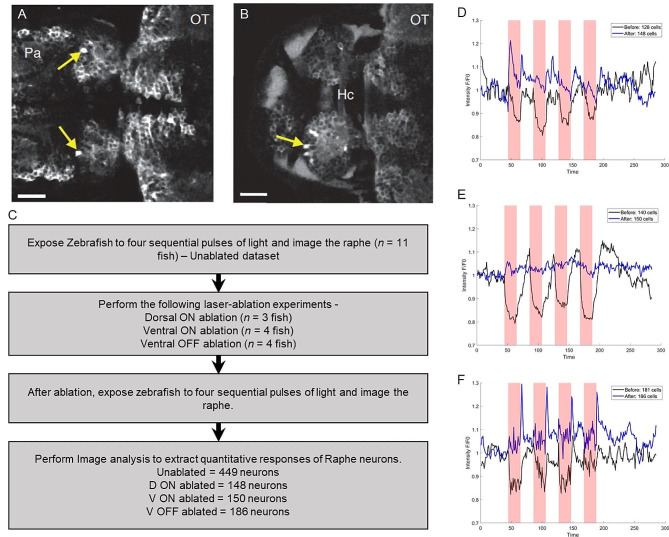
The effects of lesioning specific cells in the habenula on raphe response to irradiance change. (A-B) Examples of lesioning. The arrows indicate individual cells with elevated levels of intracellular calcium, following two-photon laser lesioning. (C) Workflow of raphe analysis. (D-F) The response of raphe (y-axis) vs. time (x-axis) when the habenula is intact (black curve) vs. when specific cells are lesioned in the habenula (blue curve). Red regions correspond to periods of light exposure. When the habenula is intact, the raphe is inhibited during light exposure in all three experiments. (D) The raphe shows inconsistent activation during light exposure when ON cells in the dorsal habenula (D-ON) are ablated. (E) The raphe is almost unresponsive when ON cells in the ventral habenula (V-ON) are ablated. (F) The raphe shows activation as soon as light is switched off, when the OFF cells in the ventral habenula (V-OFF) are ablated

Acknowledgments
This image is the copyrighted work of the attributed author or publisher, and ZFIN has permission only to display this image to its users. Additional permissions should be obtained from the applicable author or publisher of the image. Full text @ BMC Neurosci.