IMAGE

Fig. 4

ID
ZDB-IMAGE-240418-25
Source
Figures for Cheng et al., 2024
Image
Figure Caption

Fig. 4

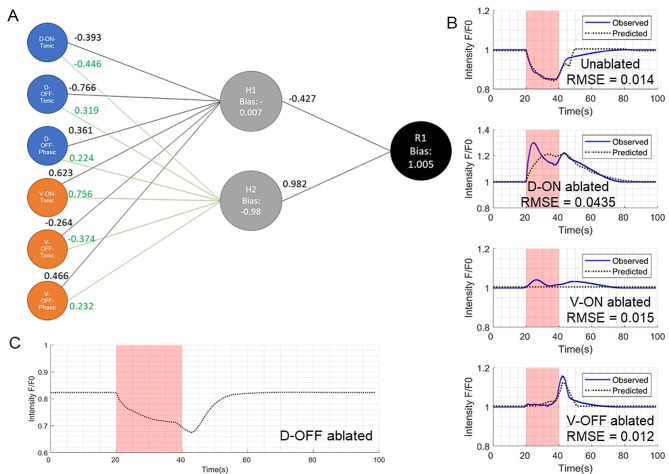
Neural network model and estimated raphe behavior. (A) The final neural network model that was able to recapitulate raphe behaviour from habenula input. The first layer of the network has six nodes corresponding to the six habenula subtypes. The middle layer has two nodes and the final output layer has one node whose output is the estimated raphe behaviour. The numbers on the edges represent the weights of the edge. (B) Observed raphe behaviour (blue) and model-estimated raphe behaviour (dotted gray) for the unablated and the ablation experiments shows good fit (RMSE of the fit shown on the plots) (C) Model-estimated raphe response for a potential D-OFF ablation experiment

Acknowledgments
This image is the copyrighted work of the attributed author or publisher, and ZFIN has permission only to display this image to its users. Additional permissions should be obtained from the applicable author or publisher of the image. Full text @ BMC Neurosci.