
Fig. 3
- ID
- ZDB-IMAGE-240415-41
- Publication
- Crouzier et al., 2023 - Convolamine, a tropane alkaloid extracted from Convolvulus plauricalis, is a potent sigma-1 receptor-positive modulator with cognitive and neuroprotective properties
- All Figures
- Figures for Crouzier et al., 2023
|
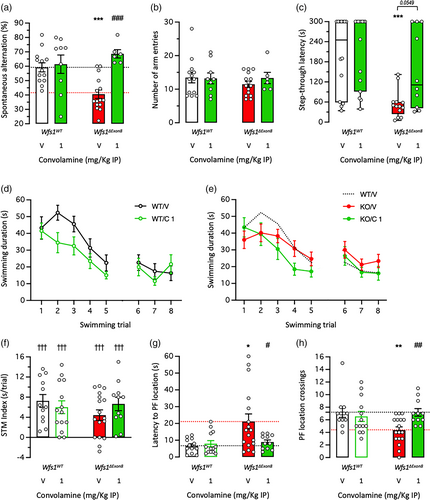
Fig. 3 Neuroprotective effect of Convolamine on learning impairments in 3-month-old Wfs1∆Exon8 mice: (a), (b) spontaneous alternation in the Y-maze; (c) step-through passive avoidance; and (d)–(h) active avoidance in the rectangular water-maze. Animals received Convolamine (0.3 and 1 mg/kg IP) 20 min before the Y-maze session or training sessions for the passive and active avoidance tests. Retention was measured 24 h after training for passive avoidance and 72 h after training for active avoidance, without drug injection. (a) Spontaneous alternation percentage and (b) number of arm entries in the Y-maze test. (c) Step-through latency during the passive avoidance retention session. (d), (e) Active avoidance acquisition profiles in the rectangular water-maze, (f) short-term memory (STM) index, (g) latency to reach the platform location and (h) platform location crossings during the retention sesion. Bar graphs show mean ± SEM and individual data in (a), (b), (f)–(h) and box-and-wisker graphs show median and interquartile range and individual data in (c). The numbers of animals per groups were: n = 6–15 in (a), (b), n = 10–15 in (c), n = 11–17 in (d)–(h). Two-way ANOVAs: F(1,39) = 1.847, p > 0.05 for the genotype, F(1,39) = 12.87, p = 0.0009 for the treatment, F(1,39) = 9.362, p = 0.0040 for the interaction in (a); F(1,39) = 0.3975, p > 0.05 for the genotype, F(1,39) = 0.2478, p > 0.05 for the treatment, F(1,39) = 0.4856, p > 0.05 for the interaction in (b); F(1,49) = 1.220, p > 0.05 for the genotype, F(1,49) = 0.3765, p > 0.05 for the treatment, F(1,49) = 1.608, p > 0.05 for the interaction in (f); F(1,49) = 5.867, p = 0.0192 for the genotype, F(1,49) = 2.993, p > 0.05 for the treatment, F(1,49) = 4.442, p = 0.0402 for the interaction in (g); F(1,49) = 2.388, p > 0.05 for the genotype, F(1,49) = 2.388, p > 0.05 for the treatment, F(1,49) = 6.633, p = 0.0131 for the interaction in (h). Kruskal–Wallis ANOVA: H = 16.53, p = 0.0009 in (c). * p < 0.05, ** p < 0.01, *** p < 0.001 versus V-treated Wfs1WT group; # p < 0.05, ## p < 0.01, ### p < 0.001 versus V-treated Wfs1∆Exon8 group; ††† p < 0.001 versus“0” level; Dunnett's test in (a), (b), (g), (h), Dunn's test in (c), one-column t-test in (f).