
|
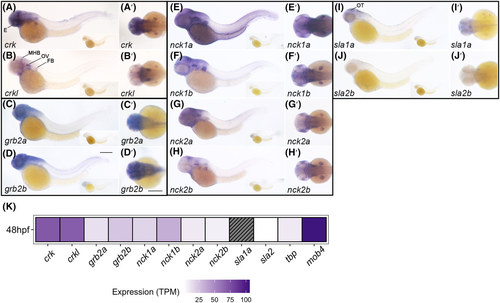
Fig. 4 SH2 and SH3 domain-containing adaptors show overlapping expression in the zebrafish nervous system at 48 hpf. Wholemount lateral (A–J) and dorsal images (A′–J′) of in situ hybridization stained zebrafish embryos showing crk (A, A′), crkl (B, B′), grb2a (C, C′), grb2b (D, D′), nck1a (E, E′), nck1b (F, F′), nck2a (G, G′), nck2b (H, H′), sla1a (I, I′), and sla2b (J, J′) mRNA expression. Inset image (A–J) is a lateral view of a control-stained embryo using a corresponding sense probe. Scale bar in D and D′ is 250 μm. (K) RNAseq expression [18] of SH2 and SH3 domain-containing adaptors with high and low expression control genes (mob4 and tbp) from whole 48 hpf zebrafish. Expression is in transcripts per million (TPM). The gray box with diagonal lines indicates no detected expression. E, eye; FB, fin bud; MHB, midbrain–hindbrain boundary; OT, optic tectum; OV, otic vesicle.