
Fig 5
- ID
- ZDB-IMAGE-240412-39
- Publication
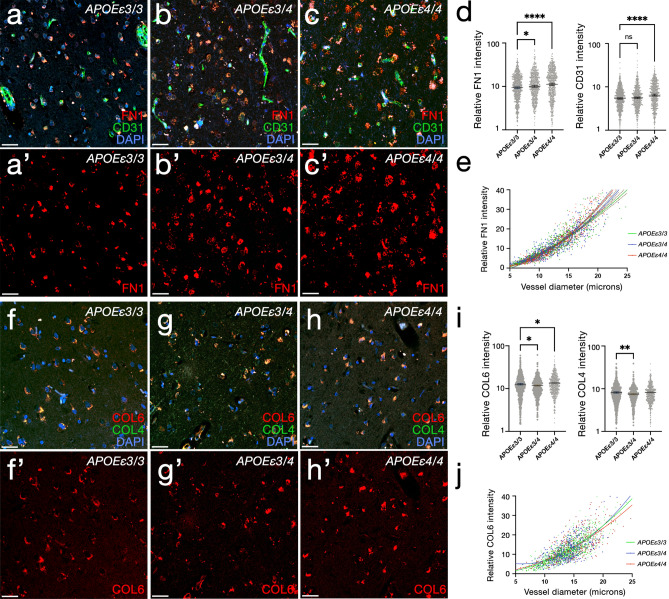
- Bhattarai et al., 2024 - Rare genetic variation in fibronectin 1 (FN1) protects against APOEε4 in Alzheimer's disease
- All Figures
- Figures for Bhattarai et al., 2024
|
Fig 5
Changes in FN1 and COL6A2 according to