
|
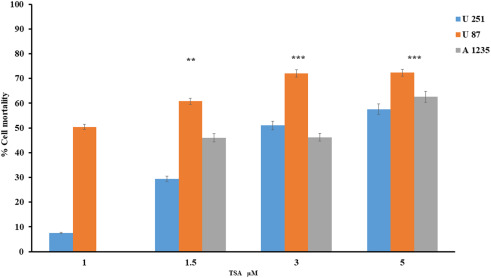
Fig. 2 The antiproliferation potential of Trichostatin A (TSA) in GBM cell lines TSA was used as positive control to compare the effect of C. procera, and TSA on cell viability of Glioblastoma cell lines. Three Glioblastoma cell lines (U87 GM, U251 GM and A1235) were treated with serial dilution (1.0, 1.5, 3.0 and 5 μg/ml) of TSA for 48 h X-values represents the concentration of extract and Y-values are percent cell mortality compared with control (mock treated cells). The bars represent the average value of three replicates and error bars are ± standard deviation between the replicates * denotes the degree of statistic difference between plant extract treated and mock treated cell lines. **p value = 0.01, ***p value = 0.001.