IMAGE

Figure 4

ID
ZDB-IMAGE-240328-45
Source
Figures for Cao et al., 2024
Image
Figure Caption

Figure 4

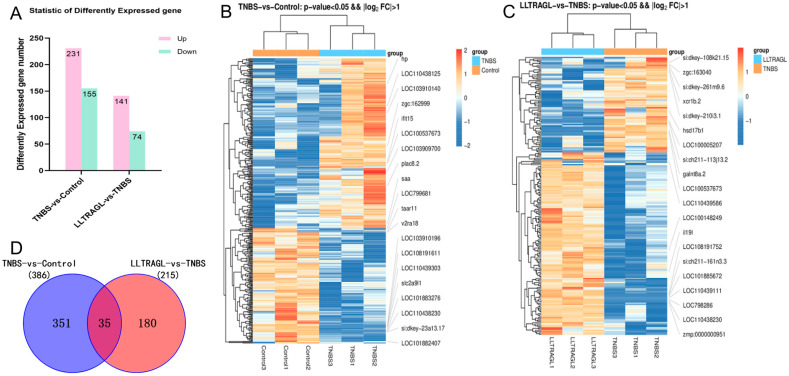
The differentially expressed genes among the control group, TNBS group and peptide treatment group in RNA-Seq. (A) Statistical histogram of differentially expressed genes in TNBS vs. Control and LLTRAGL vs. TNBS. (B) TNBS vs. Control differential gene grouping cluster diagram. (C) LLTRAGL vs. TNBS differential gene grouping cluster diagram. (D) Venn diagram of common and unique differentially expressed genes between the TNBS vs. Control and LLTRAGL vs. TNBS comparative groups. The red color in the figure represents genes encoding relatively high expression proteins, while the blue color represents genes encoding relatively low expression proteins.

Acknowledgments
This image is the copyrighted work of the attributed author or publisher, and ZFIN has permission only to display this image to its users. Additional permissions should be obtained from the applicable author or publisher of the image. Full text @ Mar. Drugs