IMAGE

Figure 7.

ID
ZDB-IMAGE-240206-54
Source
Figures for Wright et al., 2024
Image
Figure Caption

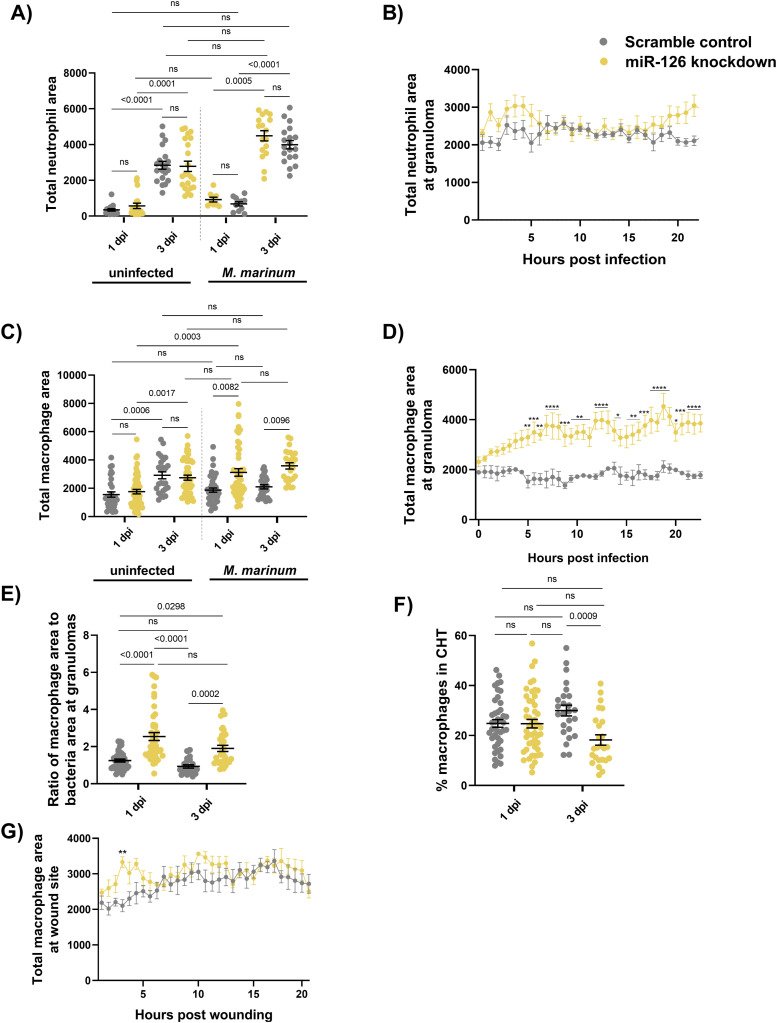
Figure 7. Mycobacterial infection-induced miR-126 expression alters the host macrophage response.

(A) Measurement of whole-body neutrophil fluorescent area at 1 and 3 dpi in scramble control and miR-126 knockdown uninfected and infected embryos. (B) Measurement of neutrophil levels after trunk infection with M. marinum in miR-126 knockdown embryos. (C) Measurement of whole-body macrophage fluorescent area at 1 and 3 dpi in uninfected and infected miR-126 knockdown embryos. (D) Measurement of macrophage levels after trunk infection with M. marinum in miR-126 knockdown embryos. (E) Ratio of macrophage fluorescent area per bacterial fluorescent area at granulomas in miR-126 knockdown embryos at 1 and 3 dpi. (F) Percent of macrophages residing in the caudal haematopoietic tissue in scramble control and miR-126 knockdown embryos at 1 and 3 dpi. (G) Measurement of macrophage recruitment to a tail wound in miR-126 knockdown embryos. Data information: each data point represents a single measurement with the mean and SEM shown. For neutrophil analysis, 10–20 embryos per group were analysed and 15–50 embryos per group for macrophage analysis. For neutrophil time-lapse imaging, each data point represents the mean of six foci of infection from six separate embryos, and the graph is representative of two experimental replicates. For macrophage time-lapse imaging, each data point represents the mean of three foci of infection from three separate embryos, and the graph is representative of two experimental replicates. *P < 0.05, **P < 0.01, ***P < 0.001, ****P < 0.0001.

Acknowledgments
This image is the copyrighted work of the attributed author or publisher, and ZFIN has permission only to display this image to its users. Additional permissions should be obtained from the applicable author or publisher of the image. Full text @ Life Sci Alliance