
IMAGE
Fig. 2
- ID
- ZDB-IMAGE-240130-49
- Publication
- Kozol et al., 2023 - Drugs prescribed for Phelan-McDermid syndrome differentially impact sensory behaviors in shank3 zebrafish models
- All Figures
- Figures for Kozol et al., 2023
Image
|
Figure Caption
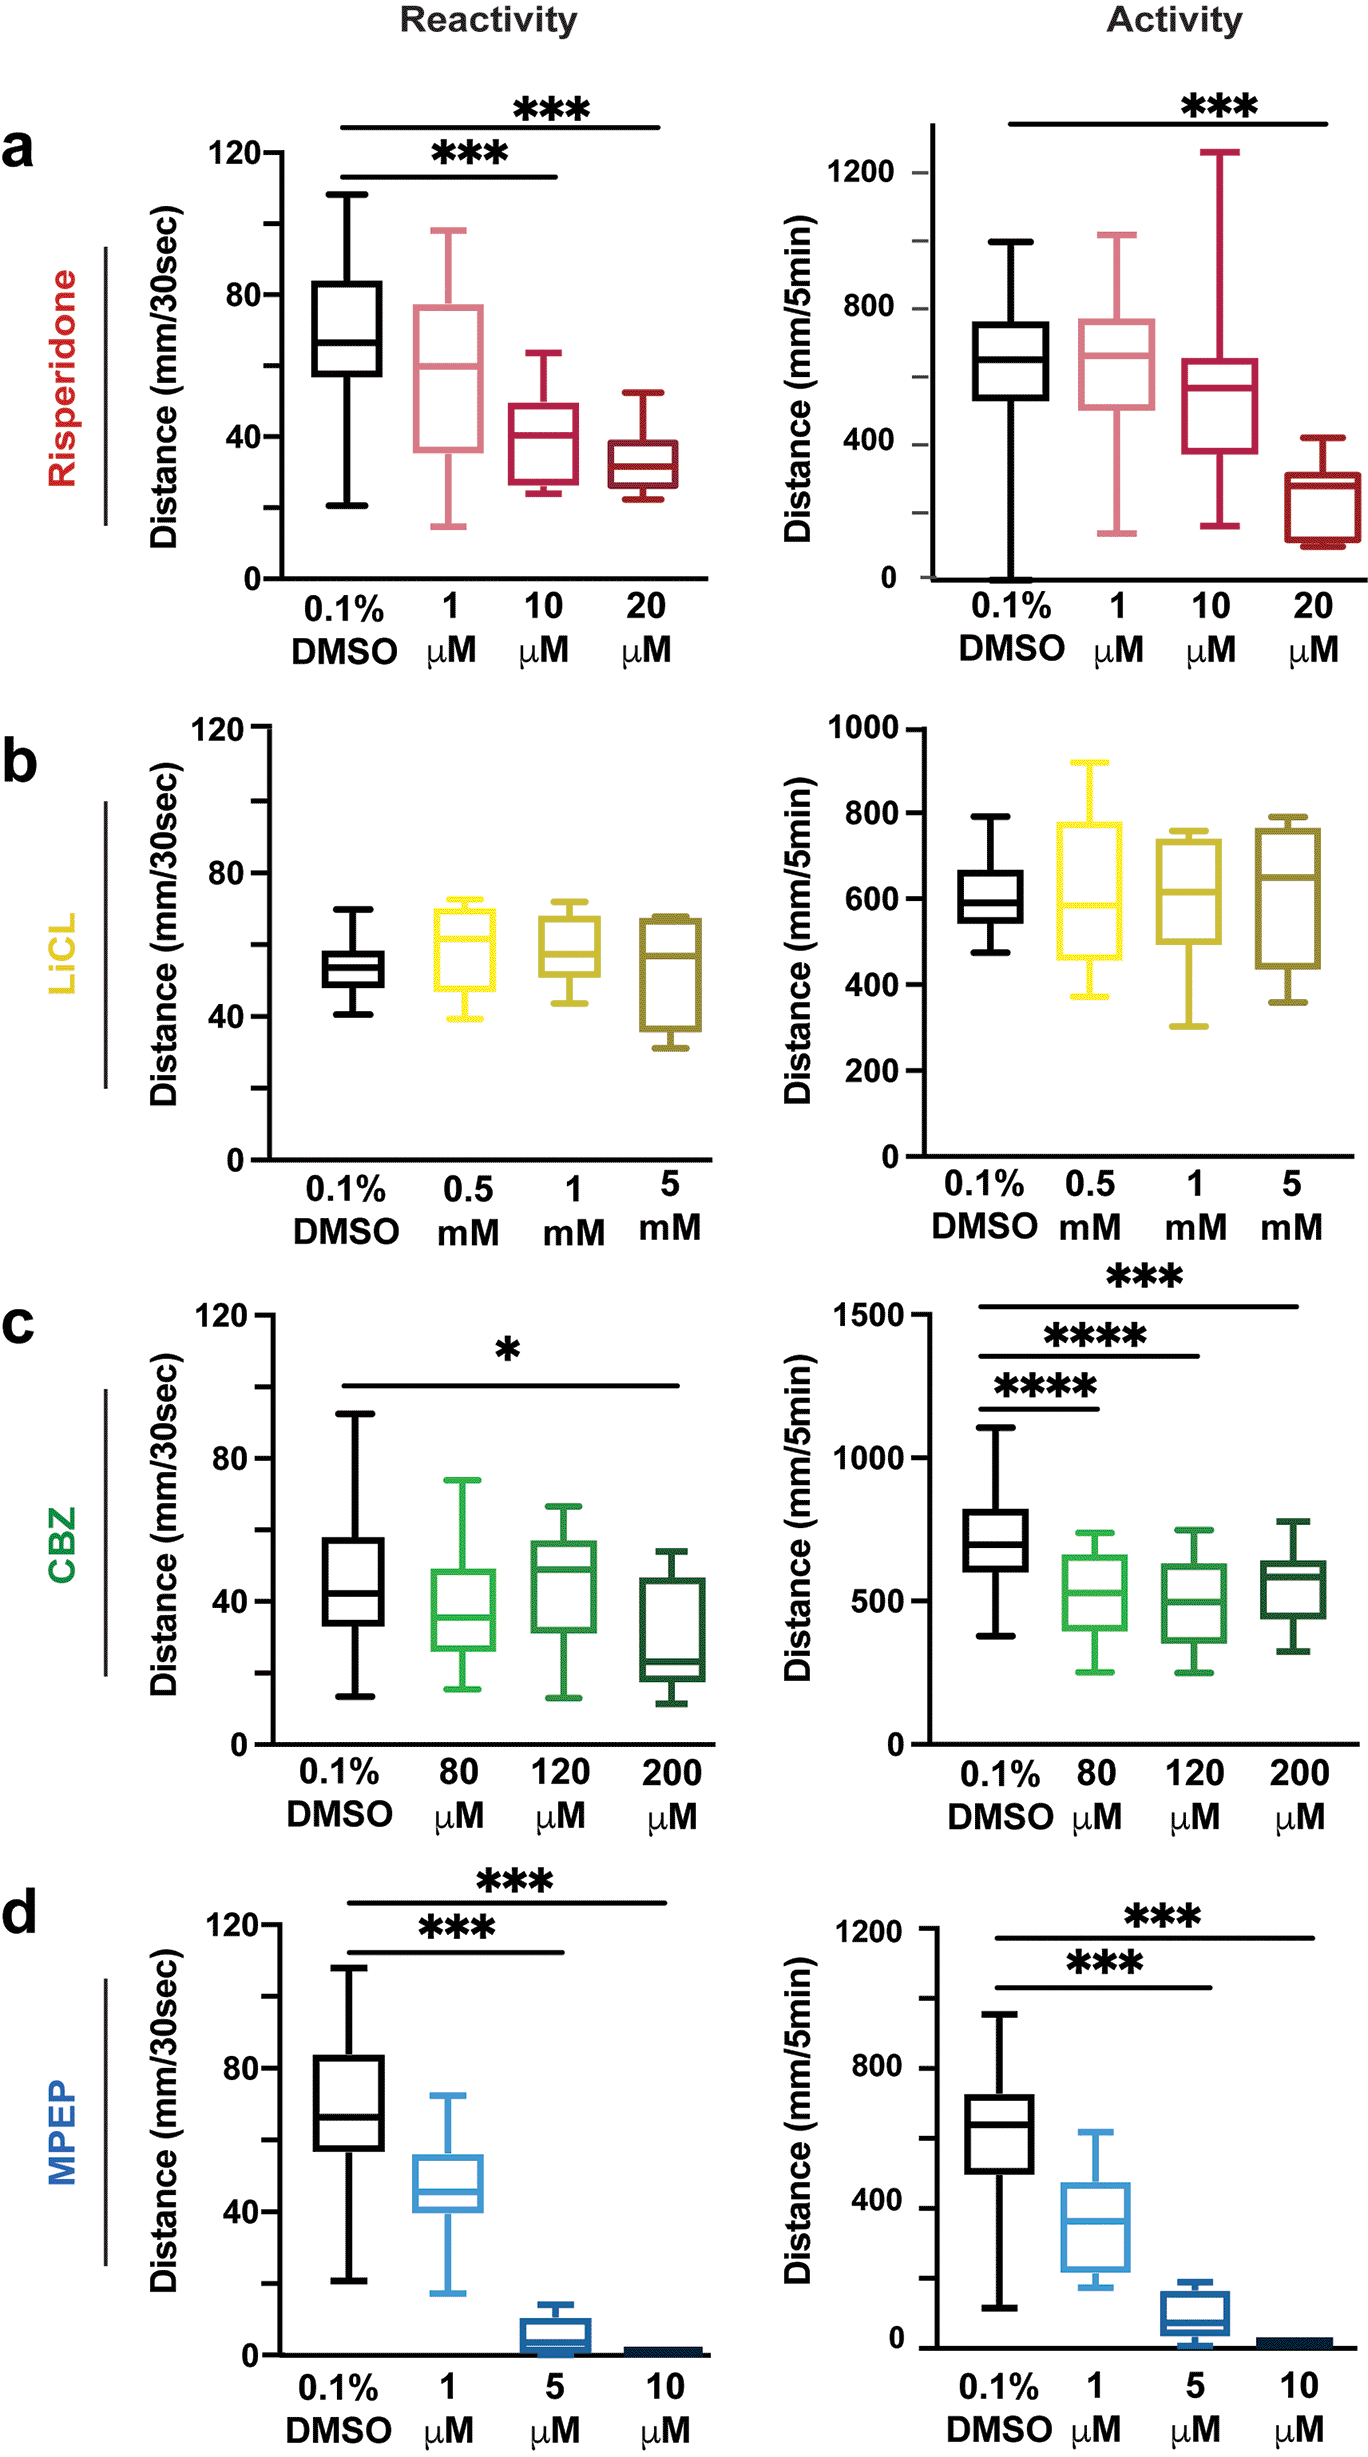
Fig. 2 Dose response curves for drugs used in visual motor response assays. a) Risperidone exposure of WT larvae in 1, 10 and 20 μM doses. b) LiCl salt exposure of 0.5, 1 and 5 mM doses. c) CBZ exposure of WT larvae in 80, 120 and 200 μM doses. d) MPEP exposure of WT larvae in 1, 5 and 10 μM doses. Box plots represent 25th and 75th percentile, and median, with min to max whiskers. Sample sizes: WT = 23, WT + risperidone = 24, shank3 N = 33, shank3 N + risperidone = 31, shank3 C = 19, shank3 C + risperidone = 23. p values; * = p < 0.05, ** = p < 0.01, *** = p < 0.001, **** = p < 0.0001.
Figure Data
Acknowledgments
This image is the copyrighted work of the attributed author or publisher, and
ZFIN has permission only to display this image to its users.
Additional permissions should be obtained from the applicable author or publisher of the image.
Full text @ F1000Res