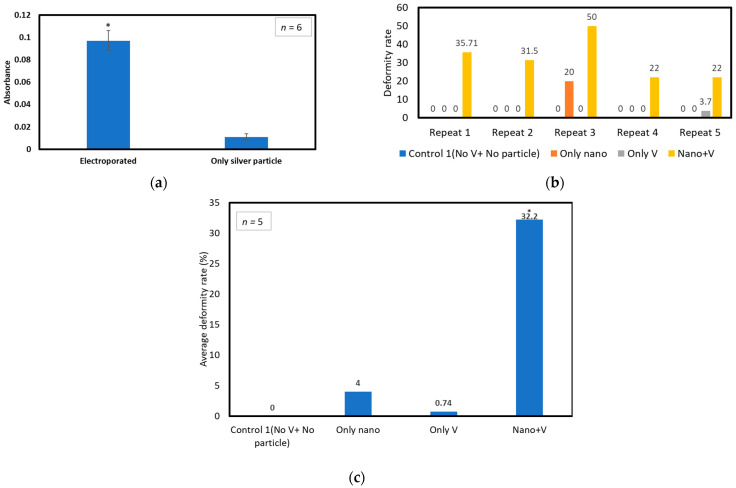
IMAGE

Figure 7

ID
ZDB-IMAGE-240129-267
Source
Figures for Tazin et al., 2023
Image
Figure Caption

Figure 7

Application of electric field: (a) Absorbance calculation for concentration of 60 µg/mL of AgNP exposure for 40 min. “*” indicates statistically significant difference (p-value < 0.05) when compared with only silver particle. (b) Deformity rate of embryos after exposure to 60 µg/mL of AgNPs for 24 h for five repetitions. (c) Average deformity rate of five repetitions after exposure to 60 µg/mL of AgNPs for 24 h. Here, Only Nano indicates the embryos were exposed to AgNPs only. Only V indicates embryos were exposed to only voltage pulses with a chamber filled with E3 media instead of nanoparticles. Nano+V indicates embryos that are exposed to both nanoparticles and voltage pulses. “*” indicates statistically significant difference (p-value < 0.05) when compared with control 1 (No V+ NO particle).

Acknowledgments
This image is the copyrighted work of the attributed author or publisher, and ZFIN has permission only to display this image to its users. Additional permissions should be obtained from the applicable author or publisher of the image. Full text @ Micromachines (Basel)