
IMAGE
FIGURE 3
- ID
- ZDB-IMAGE-240124-41
- Publication
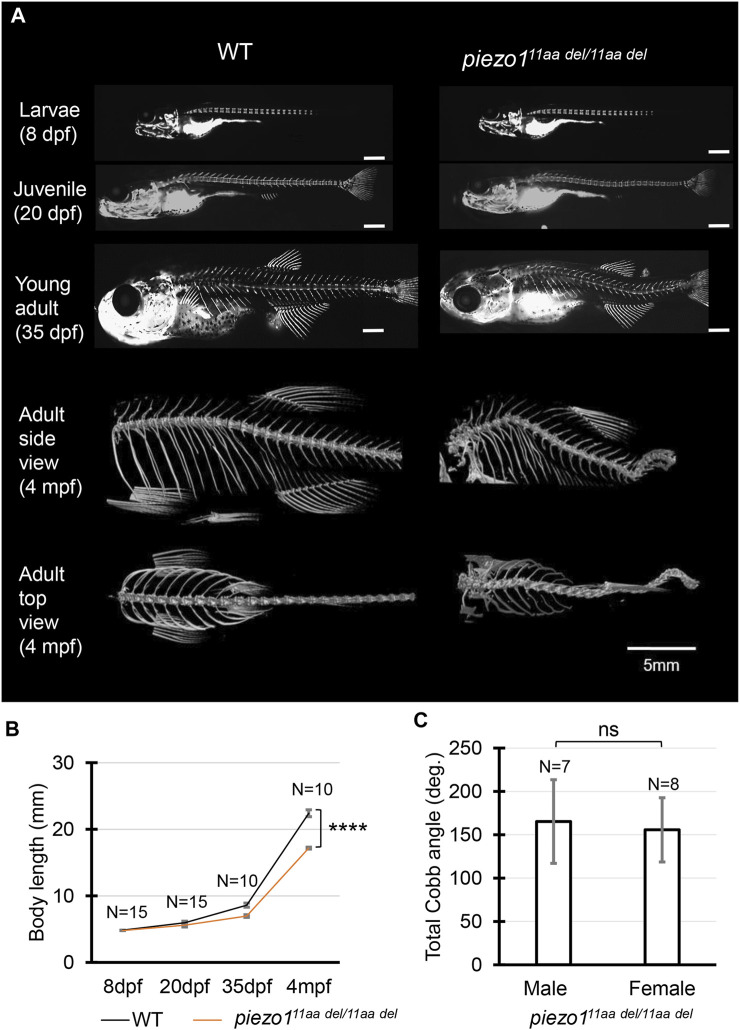
- Ramli et al., 2024 - Piezo1 mutant zebrafish as a model of idiopathic scoliosis
- All Figures
- Figures for Ramli et al., 2024
Image
|
Figure Caption
FIGURE 3
Phenotype of
Figure Data
Acknowledgments
This image is the copyrighted work of the attributed author or publisher, and
ZFIN has permission only to display this image to its users.
Additional permissions should be obtained from the applicable author or publisher of the image.
Full text @ Front Genet