
Fig. 7
- ID
- ZDB-IMAGE-240124-36
- Publication
- Rodríguez-Ruiz et al., 2023 - ZAKα/P38 kinase signaling pathway regulates hematopoiesis by activating the NLRP1 inflammasome
- All Figures
- Figures for Rodríguez-Ruiz et al., 2023
|
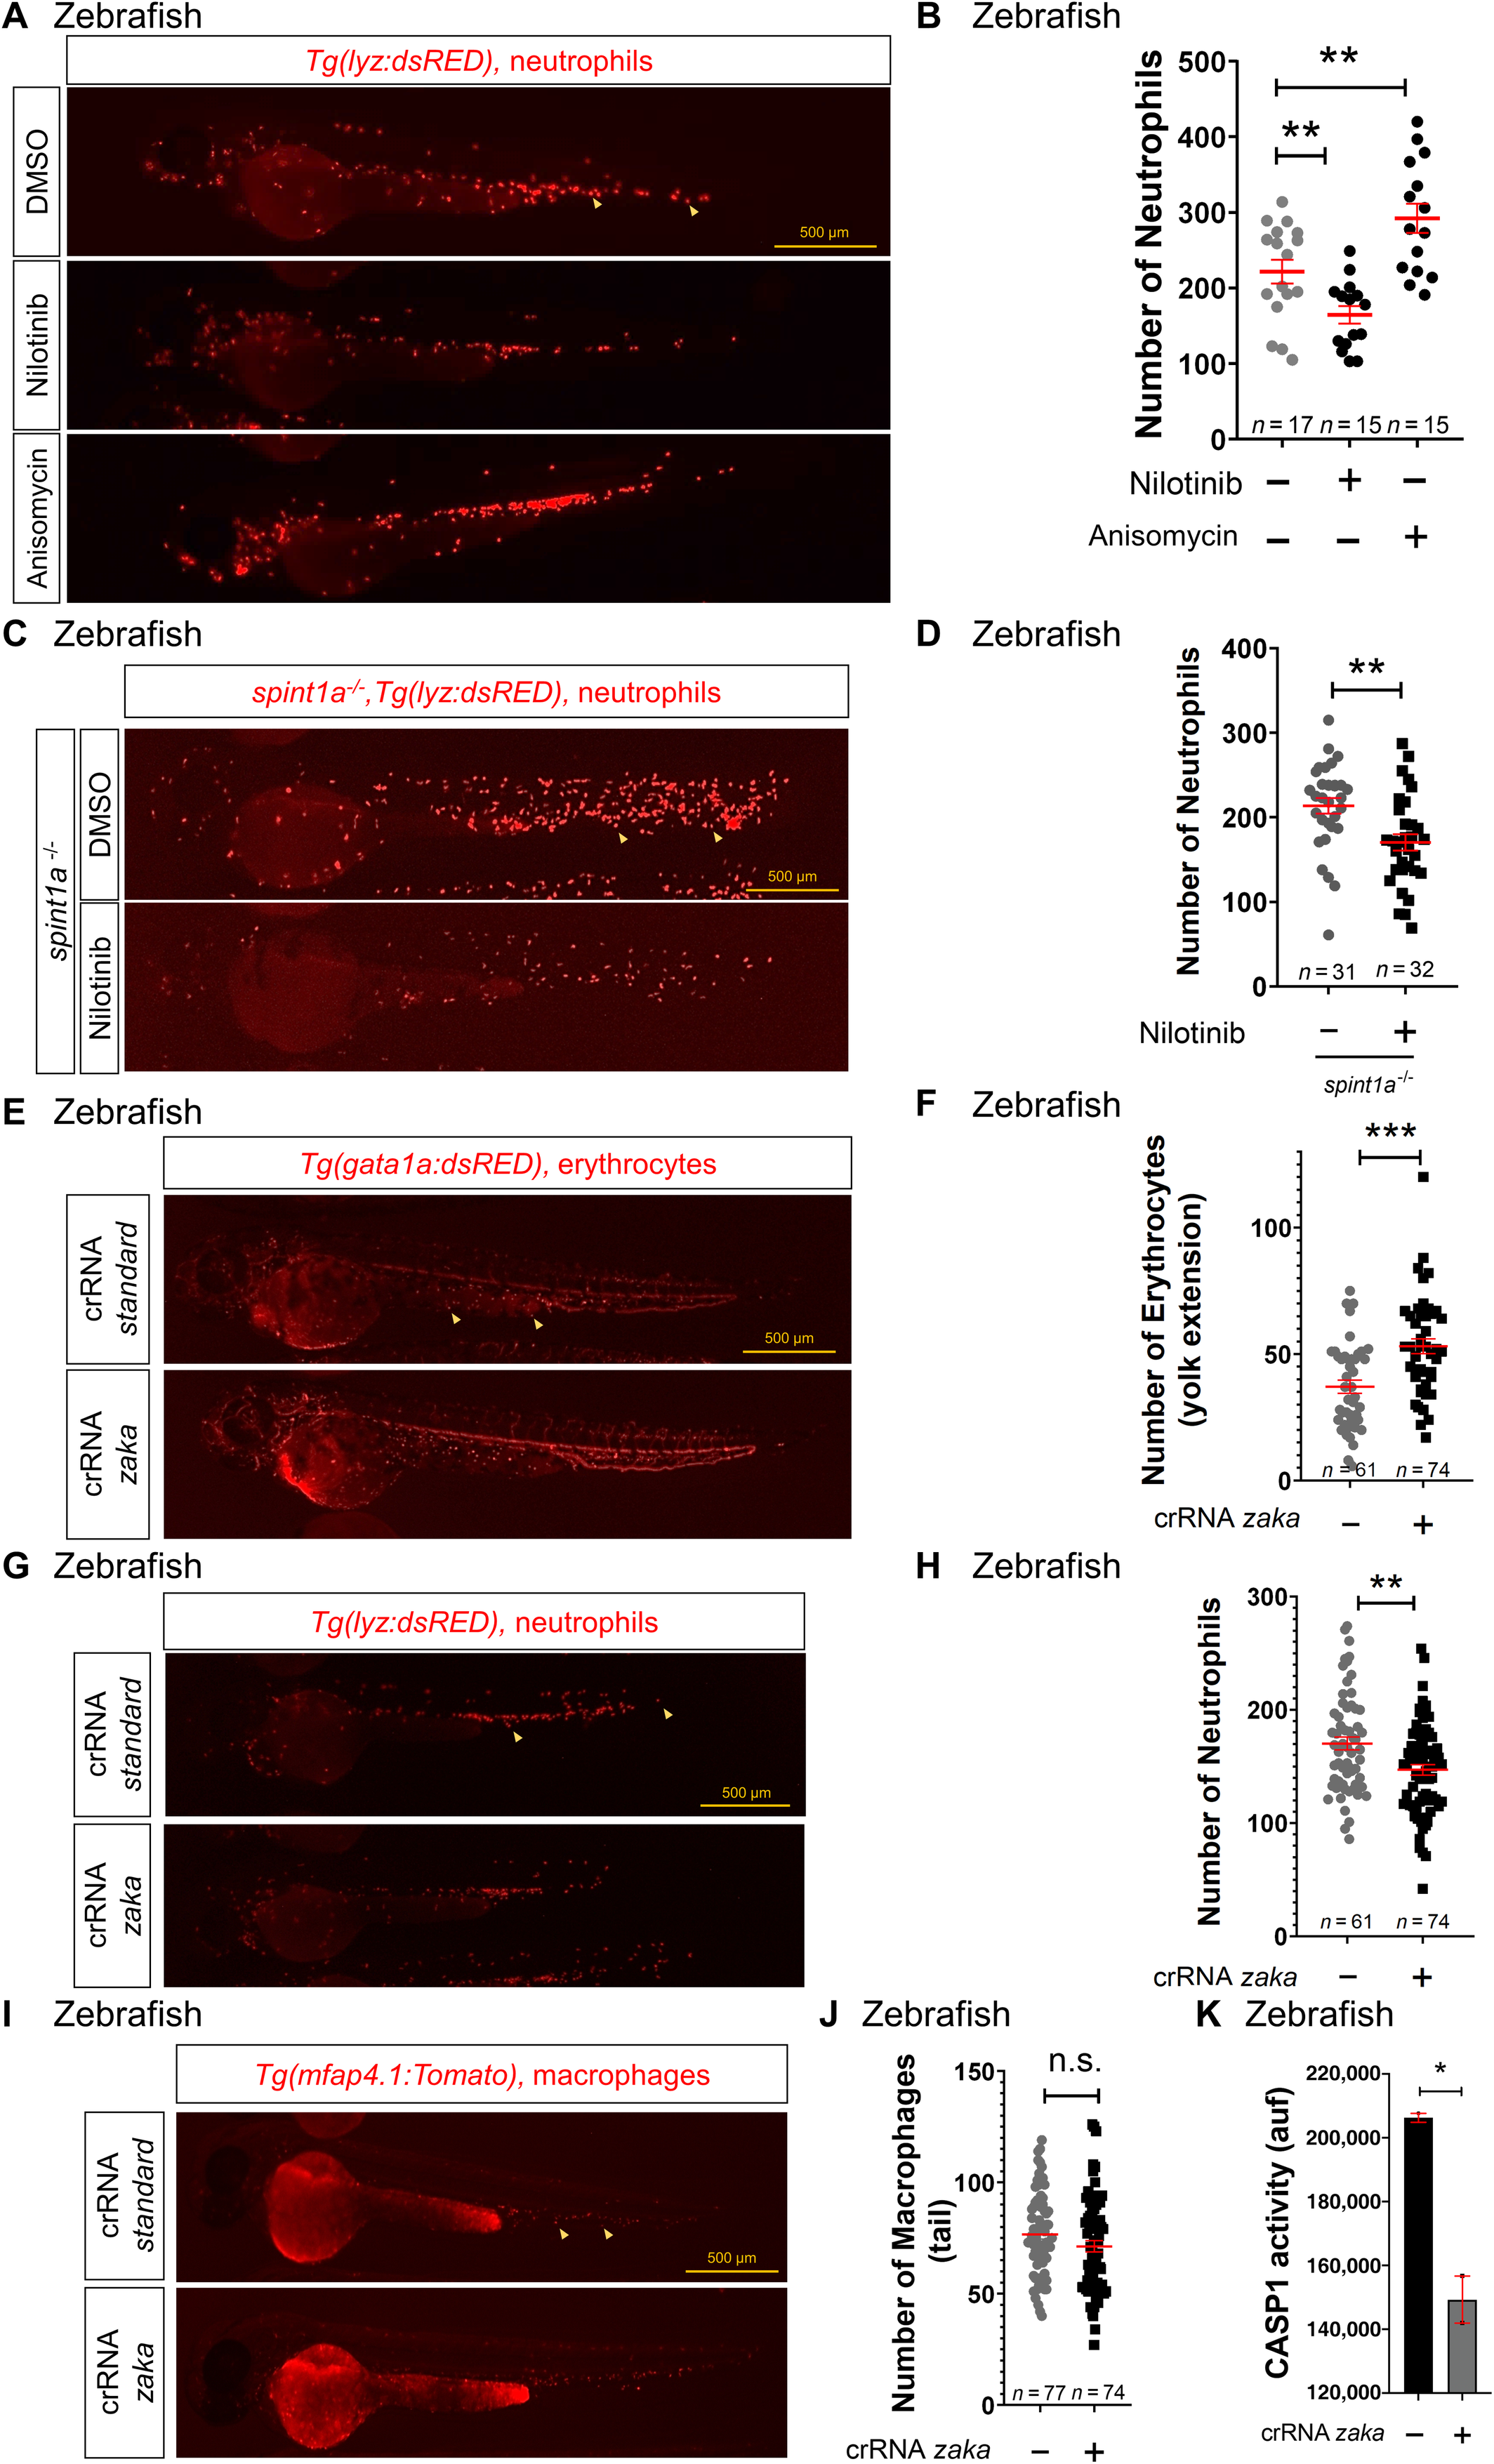
Fig. 7 ZAKα regulates hematopoiesis in zebrafish through the Nlrp1 inflammasome A–K Number of neutrophils (B, D, H), erythrocytes (F) and macrophages (J), and caspase‐1 activity (K) in 2 dpf larvae either treated from 1 to 2 dpf by bath immersion with 1 μM nilotinib and/or 100 μM anisomycin (A–D) or obtained by injecting one‐cell stage embryos with standard or zaka crRNAs/Cas9 complexes (E–K). Representative images of neutrophils (A, C, G), erythrocytes (E) and macrophages (I) are also shown. Each dot represents one individual and the mean ± SEM for each group is also shown. P values were calculated using one‐way ANOVA and Tukey's multiple range test (B) or Student's t‐test (D, F, H, J, K). Data are shown as the means ± SEM of two technical replicates in (K). n.s., non‐significant; *P < 0.05; **P < 0.01; ***P < 0.001.